.svg)
Please note that this feature may not be available for all OCP environments. Availability can vary depending on the specific environment configuration and deployment setup.
Alerting Service helps you monitor key conversation metrics and receive e-mail notifications when a selected threshold is reached. It is available through the Insights interface in OCP Console® and is designed to let you create, review, pause, resume, edit, and delete alerts without leaving the UI.
Use Alerting Service when you want proactive visibility into important conversation changes, such as rising error rates, increased no-match counts, or other metric movements that require action.
Overview
Alerting Service lets you configure threshold-based alerts for selected OCP metrics. When the metric value meets the configured condition, the service sends an e-mail notification to the recipients you define.
The feature is intended for operational monitoring and fast response. Instead of manually checking dashboards, you can define alert rules for the metrics that matter to your team and receive notifications when business-critical behavior changes.
From the UI, you can:
-
Create a new alert.
-
View a list of existing alerts across accessible OCP groups.
-
Review the current status of each alert.
-
Edit an existing alert configuration.
-
Pause or resume an alert.
-
Delete an alert.
-
Review the history of alert evaluations and triggers.
How alerting works
Each alert is tied to a single metric and one OCP group. You define a threshold, an operator, an evaluation interval, an evaluation window, optional filters, and one or more e-mail recipients.
The service evaluates active alerts every five minutes. For version 1, both the evaluation interval and the evaluation period use five-minute windows.
Notifications are sent only when the alert enters the TRIGGER state. If no data exists for the evaluation window, or if the metric cannot be evaluated, the event is recorded for visibility but no e-mail is sent.
The evaluation result can appear as one of the following states:
|
State |
Description |
E-mail sent |
|---|---|---|
|
|
The metric value is returned and the configured threshold condition is met. |
Yes |
|
|
The metric value is returned and the threshold condition is not met. |
No |
|
|
No metric series is returned for the evaluation window. |
No |
|
|
The metric cannot be evaluated successfully, such as when the returned expression value is null or the metric request fails. |
No |
Configure an alert
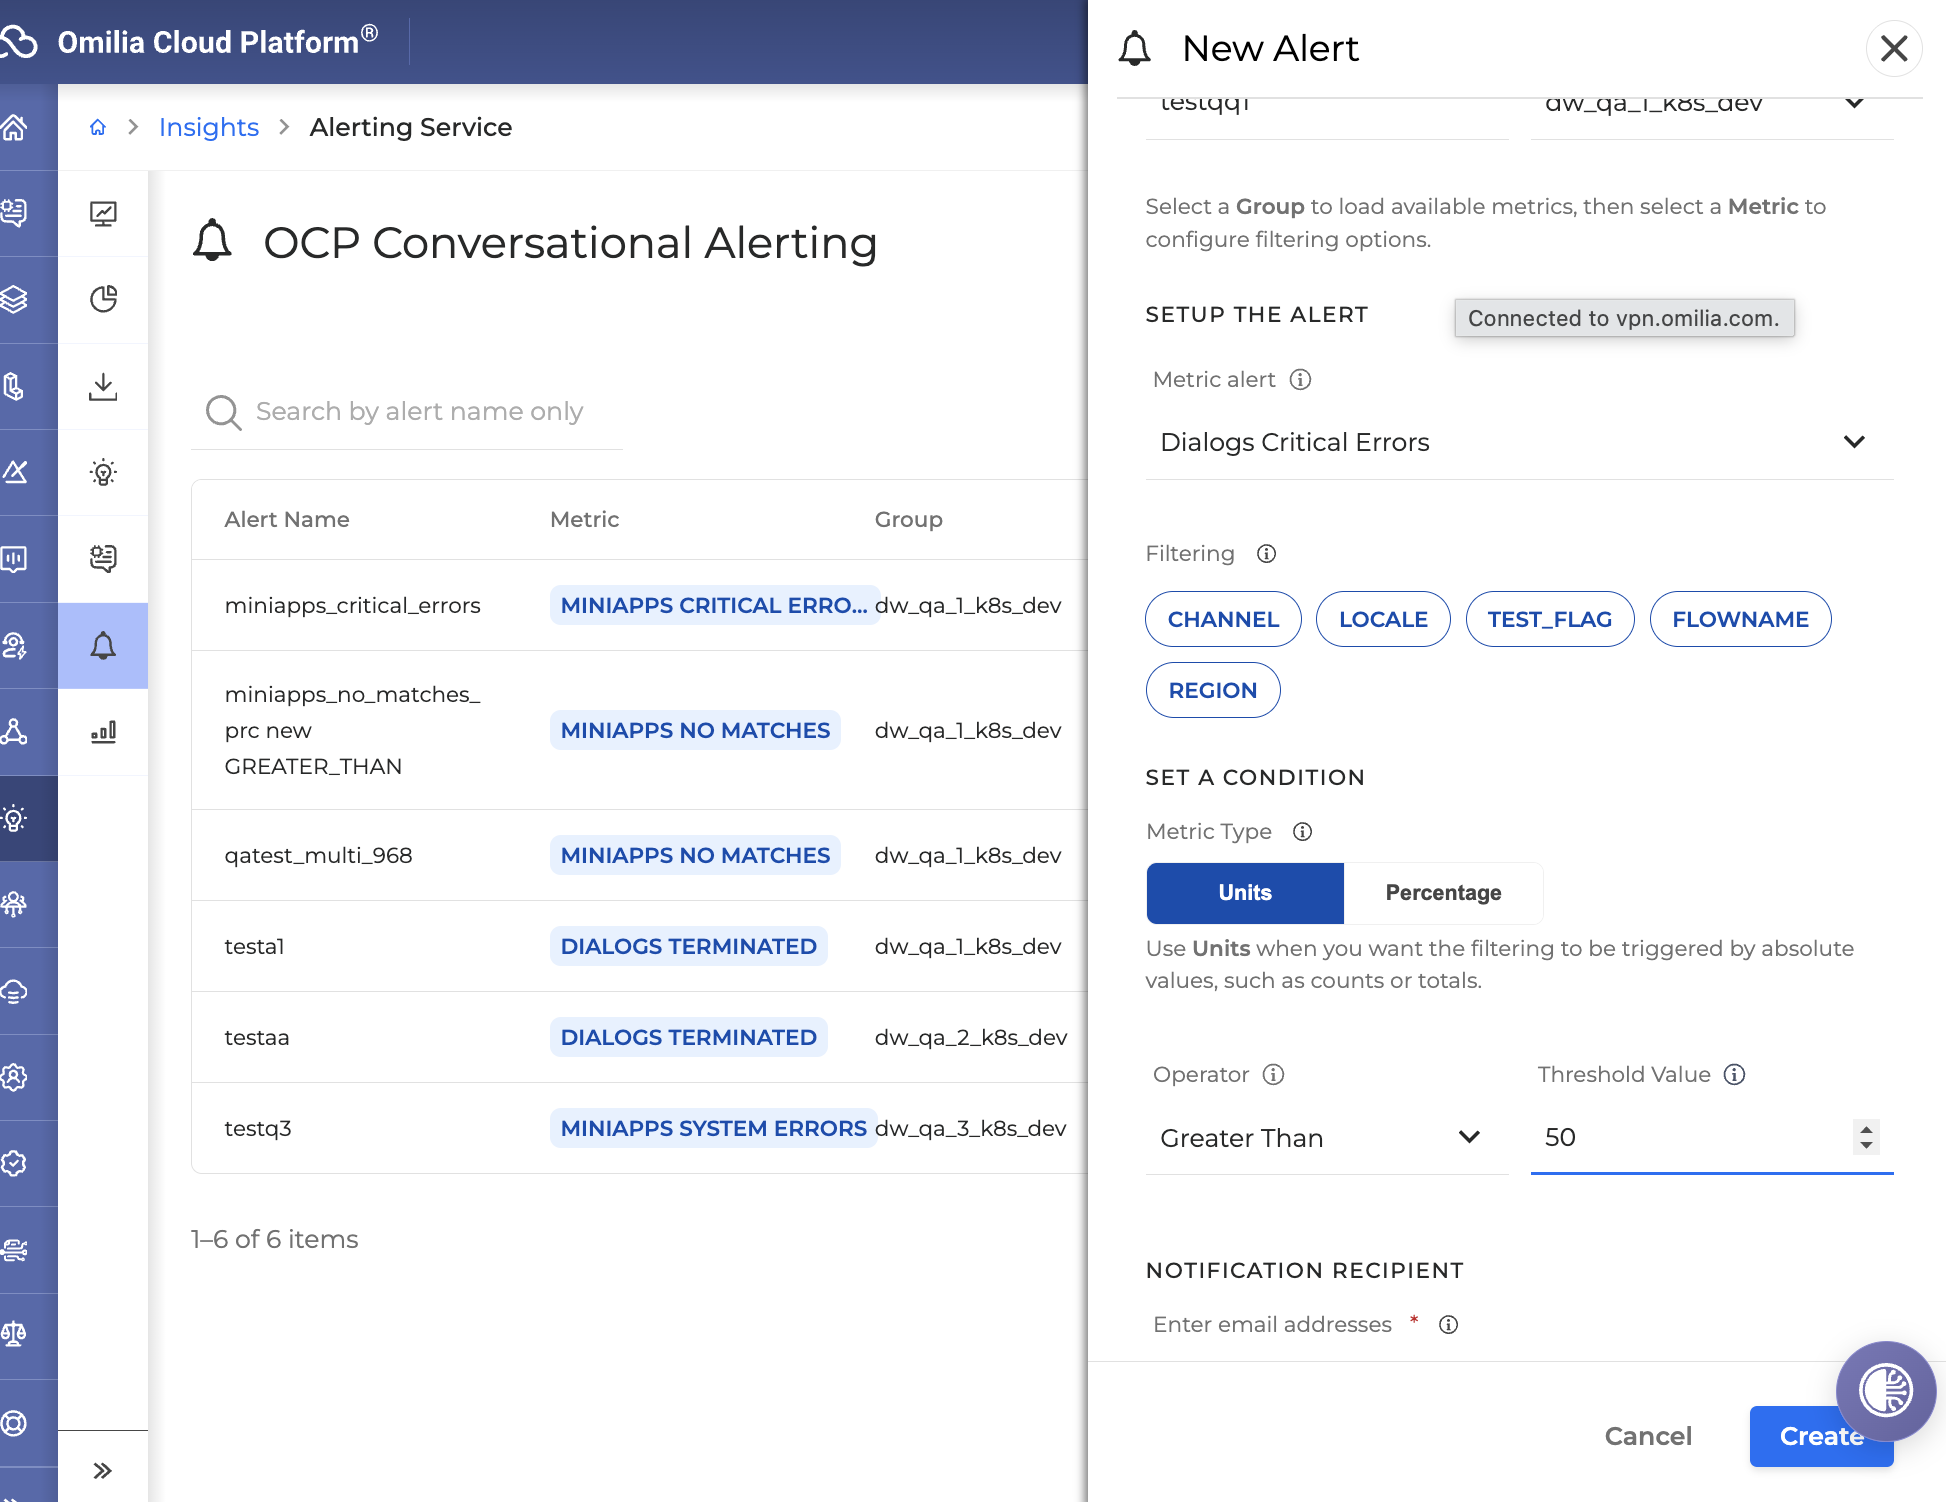
When you create or edit an alert, the UI presents the alert configuration fields required by the service.
|
Field |
Description |
Notes |
|---|---|---|
|
Alert name |
Name of the alert. |
Must be unique within the OCP group. |
|
Group name |
OCP group where the alert is created. |
All alert resources are scoped per group. |
|
Metric name |
Metric to evaluate. |
The UI shows the display name of the metric. |
|
Units or Percentage |
Metric variant selector when both variants exist for the same display name. |
If only one variant exists, the toggle is hidden. |
|
Filters |
Optional conditions that narrow the evaluated data. |
Only filters valid for the selected metric are available. |
|
Threshold |
Numeric value that the service compares with the metric result. |
Supports threshold-based alerting. |
|
Operator |
Comparison condition for the threshold. |
Supported operators include greater than, less than, greater than or equals, less than or equals, and equals. |
|
Trigger interval |
How often the alert is evaluated. |
Version 1 supports five minutes. |
|
Window interval |
Time window used to compute the metric. |
Version 1 supports five minutes. |
|
Notification recipients |
E-mail recipients for alert notifications. |
Version 1 supports e-mail lists only. |
|
Condition summary |
Auto-generated summary of the alert logic. |
Helps you validate the configured condition before saving. |
If you need alerting on a percentage-based metric and the metric also has a unit-based variant, select the same display name and then choose the appropriate variant in the UI.
Metrics and filters
Alerting Service uses predefined metrics made available by the alerting backend. The metric list includes both absolute metrics and percentage-based metrics.
Examples of supported metric families include:
-
Session-level metrics, such as sessions initiated.
-
Dialog-level metrics, such as dialogs completed, terminated, transferred, critical errors, system errors, agent requests, no inputs, and no matches.
-
miniApp-level metrics, such as invocations, successful invocations, system errors, critical errors, agent requests, no inputs, and no matches.
-
Ratio metrics, such as terminated over total, transferred over total, critical errors over total, system errors over total, agent requests over total, no inputs over total, no matches over total, and corresponding miniApp ratios.
Depending on the selected metric, you can also narrow the alert scope with filters. Available filters depend on the underlying metric definition.
Examples of filter dimensions include:
-
Channel
-
Region
-
Test flag
-
Flow or application name
-
Locale
-
miniApp name
-
miniApp type
If you do not apply filters, the alert evaluates all relevant data for the selected OCP group and metric.
When multiple filter values are selected, the threshold applies to the combined result set returned by those filters.
Working with alerts in the UI
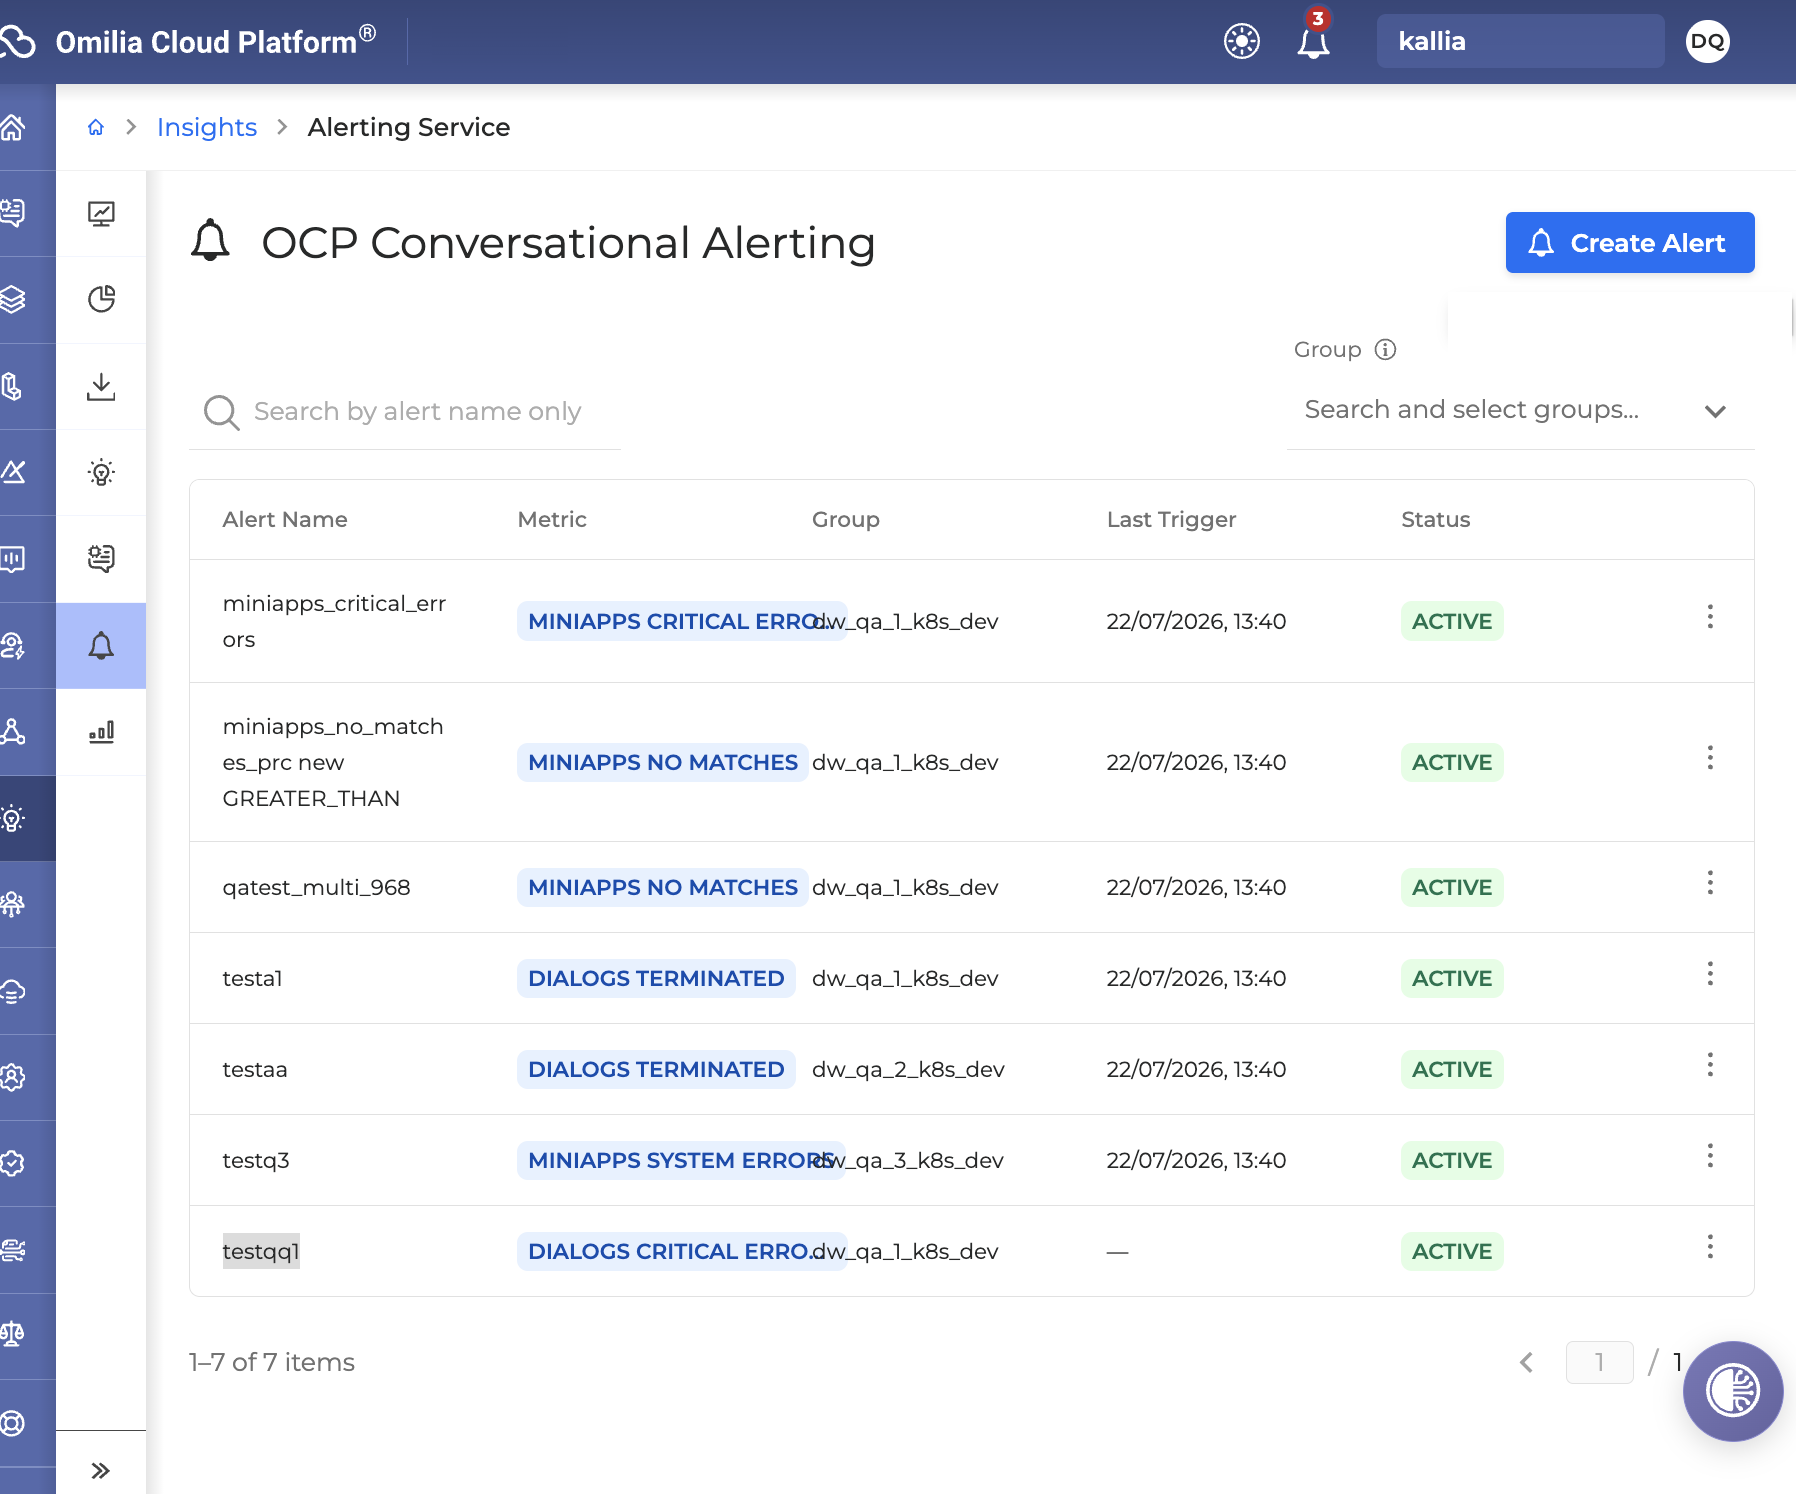
The alert list page provides a consolidated view of configured alerts. Each row shows the core information needed for monitoring and management.
|
Column |
Description |
|---|---|
|
Alert name |
Name assigned to the alert. |
|
Metric |
Associated metric display name. |
|
Group |
OCP group where the alert belongs. |
|
Status |
Whether the alert is active or inactive. |
|
Last trigger |
Most recent time the alert triggered. If it has never triggered, no timestamp is shown. |
From the list or status view, you can perform the following actions from the menu button of each alert:
-
Edit to update the alert configuration.
-
Pause to stop evaluations temporarily.
-
Resume to reactivate a paused alert.
-
Delete to remove the alert permanently.
Paused alerts are not evaluated until you resume them.
Alert history
Each evaluation cycle produces an alert event. The event history gives visibility into both successful evaluations and non-triggering outcomes.
The history view helps you answer questions such as:
-
When did the alert last trigger?
-
How often does the metric remain within normal range?
-
Was there no data for a given period?
-
Did an evaluation fail?
For each recorded event, the service stores:
-
The event timestamp.
-
The evaluated metric value, when available.
-
The resulting state.
Use alert history together with Insights dashboards to understand whether a threshold breach is an isolated incident or part of a broader trend.
Notification behavior
When an alert triggers, the service sends an e-mail to the configured recipients.
Recipient validation is tied to OCP identity and group membership controls. The service also performs cleanup of stale subscriptions, such as recipients who are no longer valid users, are inactive, do not have a verified e-mail address, or are no longer members of the relevant OCP group.
If a recipient no longer meets OCP identity or group membership requirements, the service can remove that subscription automatically.
Current scope and behavior
-
Alert evaluation runs every five minutes.
-
The evaluation window is five minutes.
-
Notifications are sent by e-mail.
-
Alerts are scoped by OCP group.
-
The UI uses metric display names and can switch between units and percentage variants when both are available.
-
Only active alerts are evaluated.