Overview
OCP® Reporting is an out-of-the-box reporting and analytics platform available for all conversations through OCP® applications. These involve Orchestrator Application dialogs, Flows, and miniApps innovations originating from calls or web chats.
OCP Reporting® provides rich, graphical dashboards with key performance metrics in order to pinpoint opportunities for continuously improving the Virtual Assistant and gaining a deeper insight into what customers are saying. The reports are unsupervised as they come directly from the system without any analysis from a human.
To access OCP® Reporting, go to Insights → Reporting in the side panel.
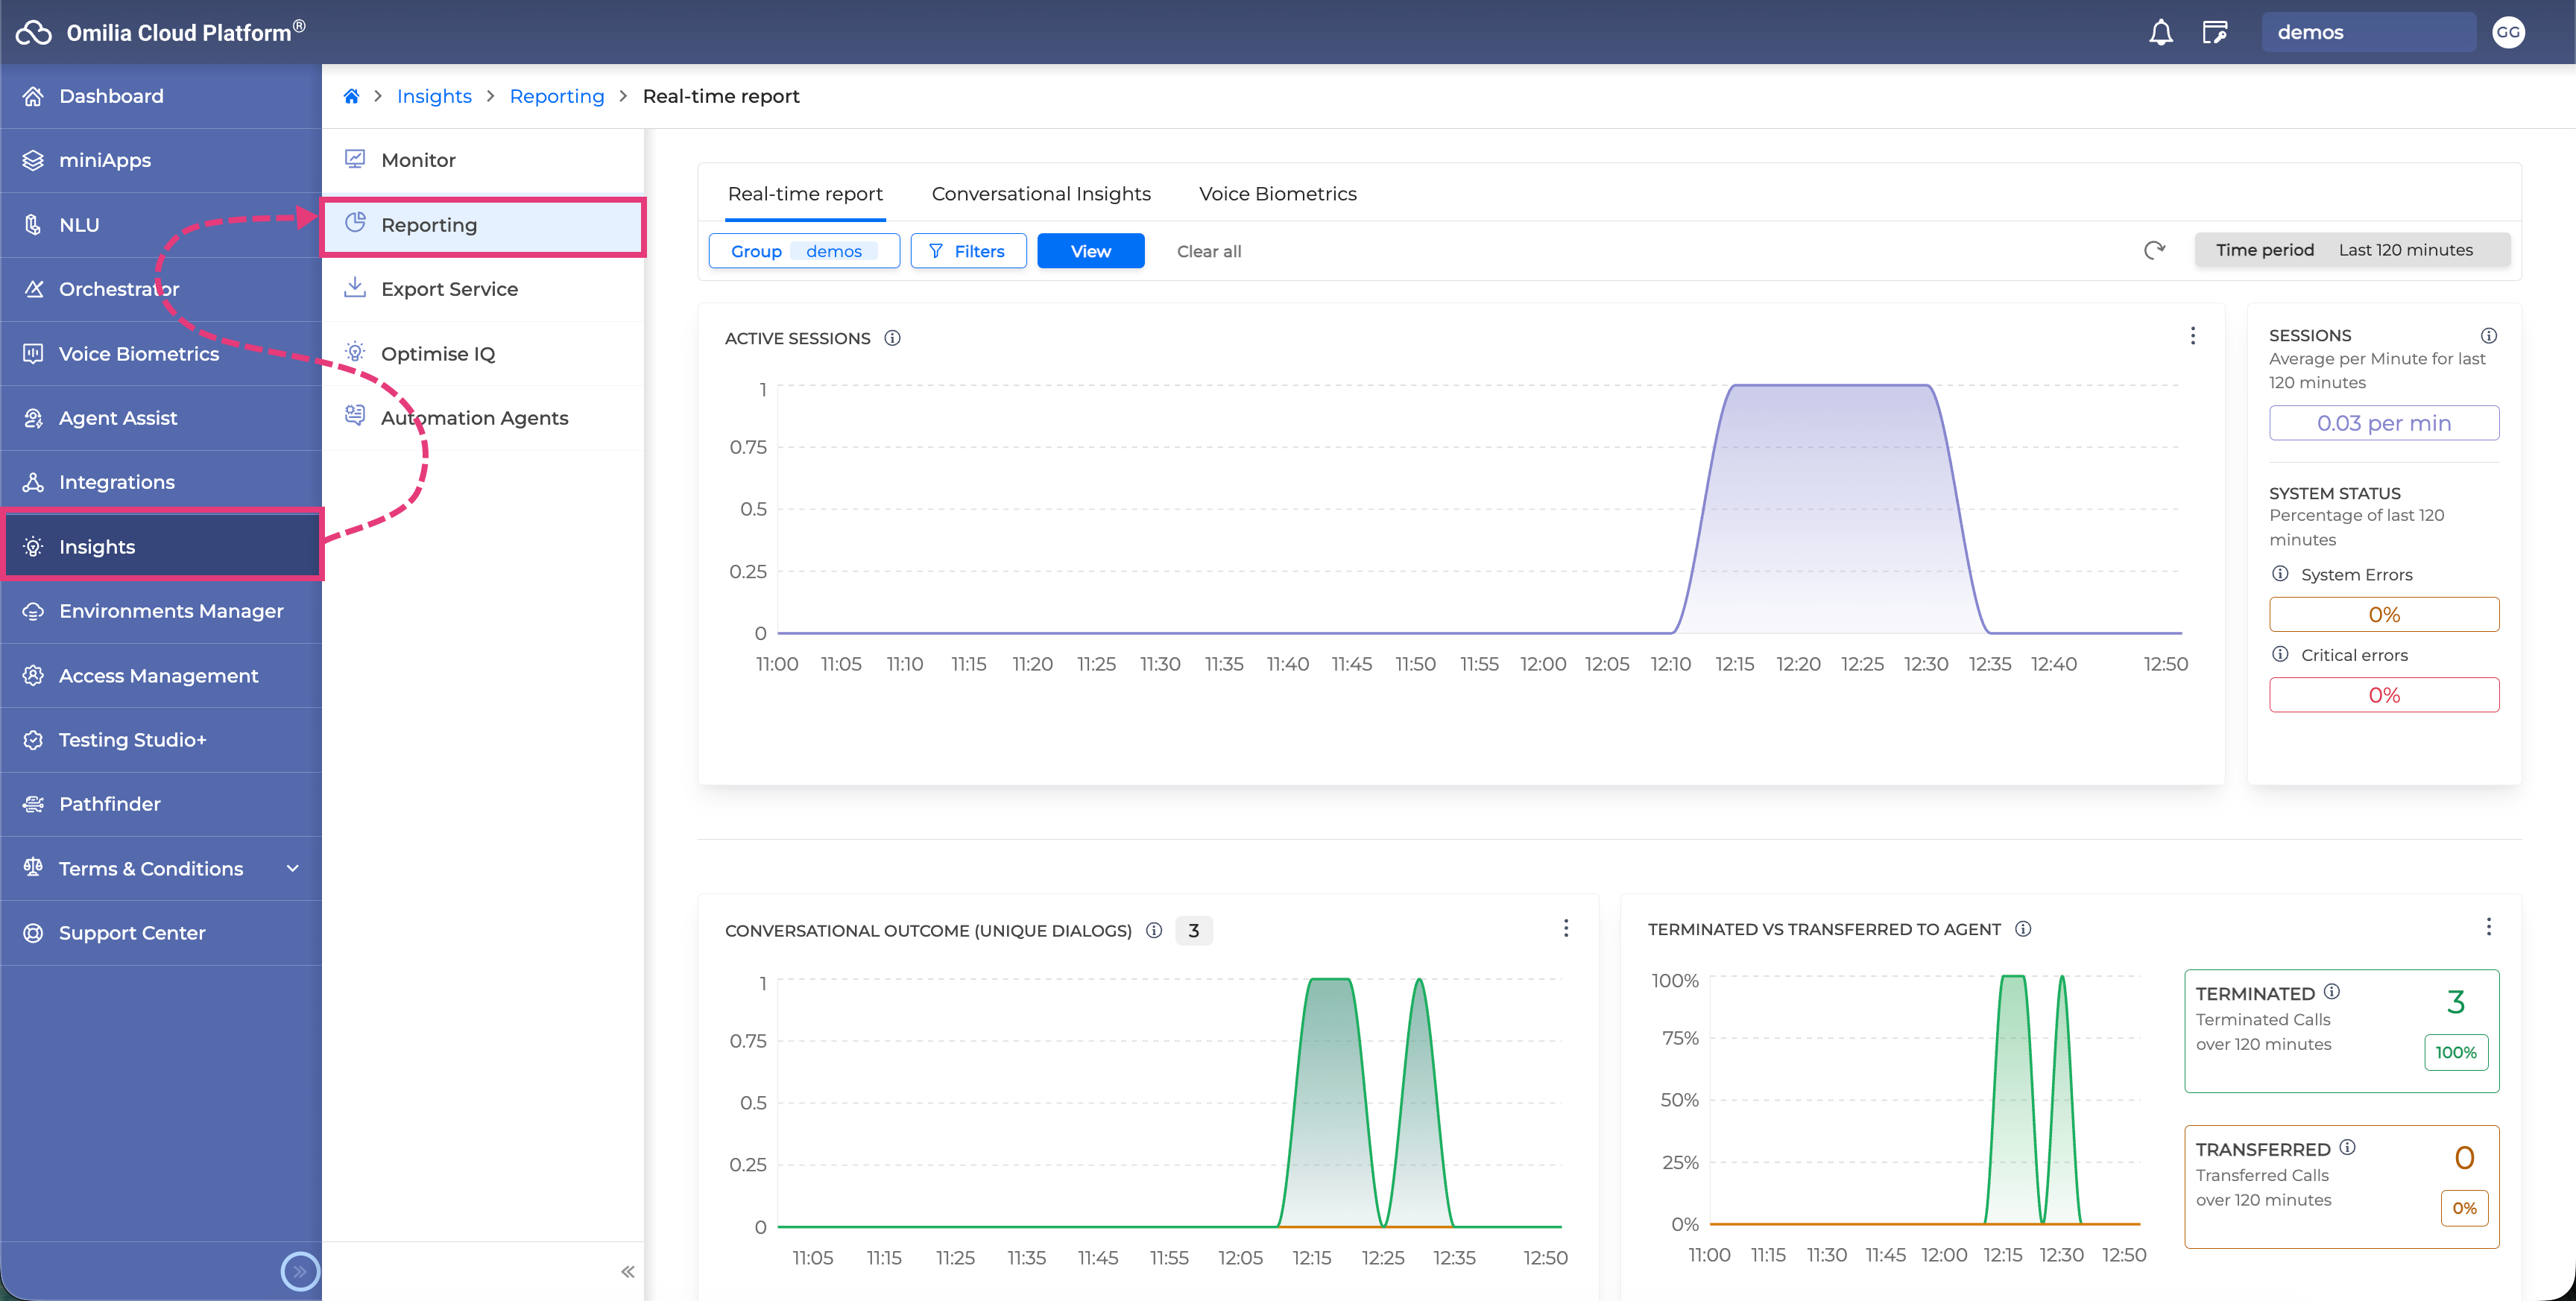
The OCP® Reporting is divided into the following tabs:
-
Real-time report puts emphasis on near real-time data.
-
Conversational Insights offers more analytical historical metrics.
-
Voice Biometrics reporting displays the enrollments and verifications data.
Real-time report
The Real-time report tab shows the necessary information about the current status of your miniApp. These reports are created from a specific selection of existing batch metrics, targeted to ensure the user is informed about the current state of their system, without being overwhelmed with information.
To produce near real-time reports on top of the underlying data, the Data Warehouse infrastructure is used. Reporting metrics are broken down into 5-minute intervals and updated near real-time, with an additional watermark of 5 minutes. This means any data delay (due to external services) can be captured even with up to a five-minute delay. These metrics are publicly available through the Metrics API.
The Real-time report is updated automatically every 60 seconds.
You can refresh the results at any time by clicking the Refresh button as shown below.
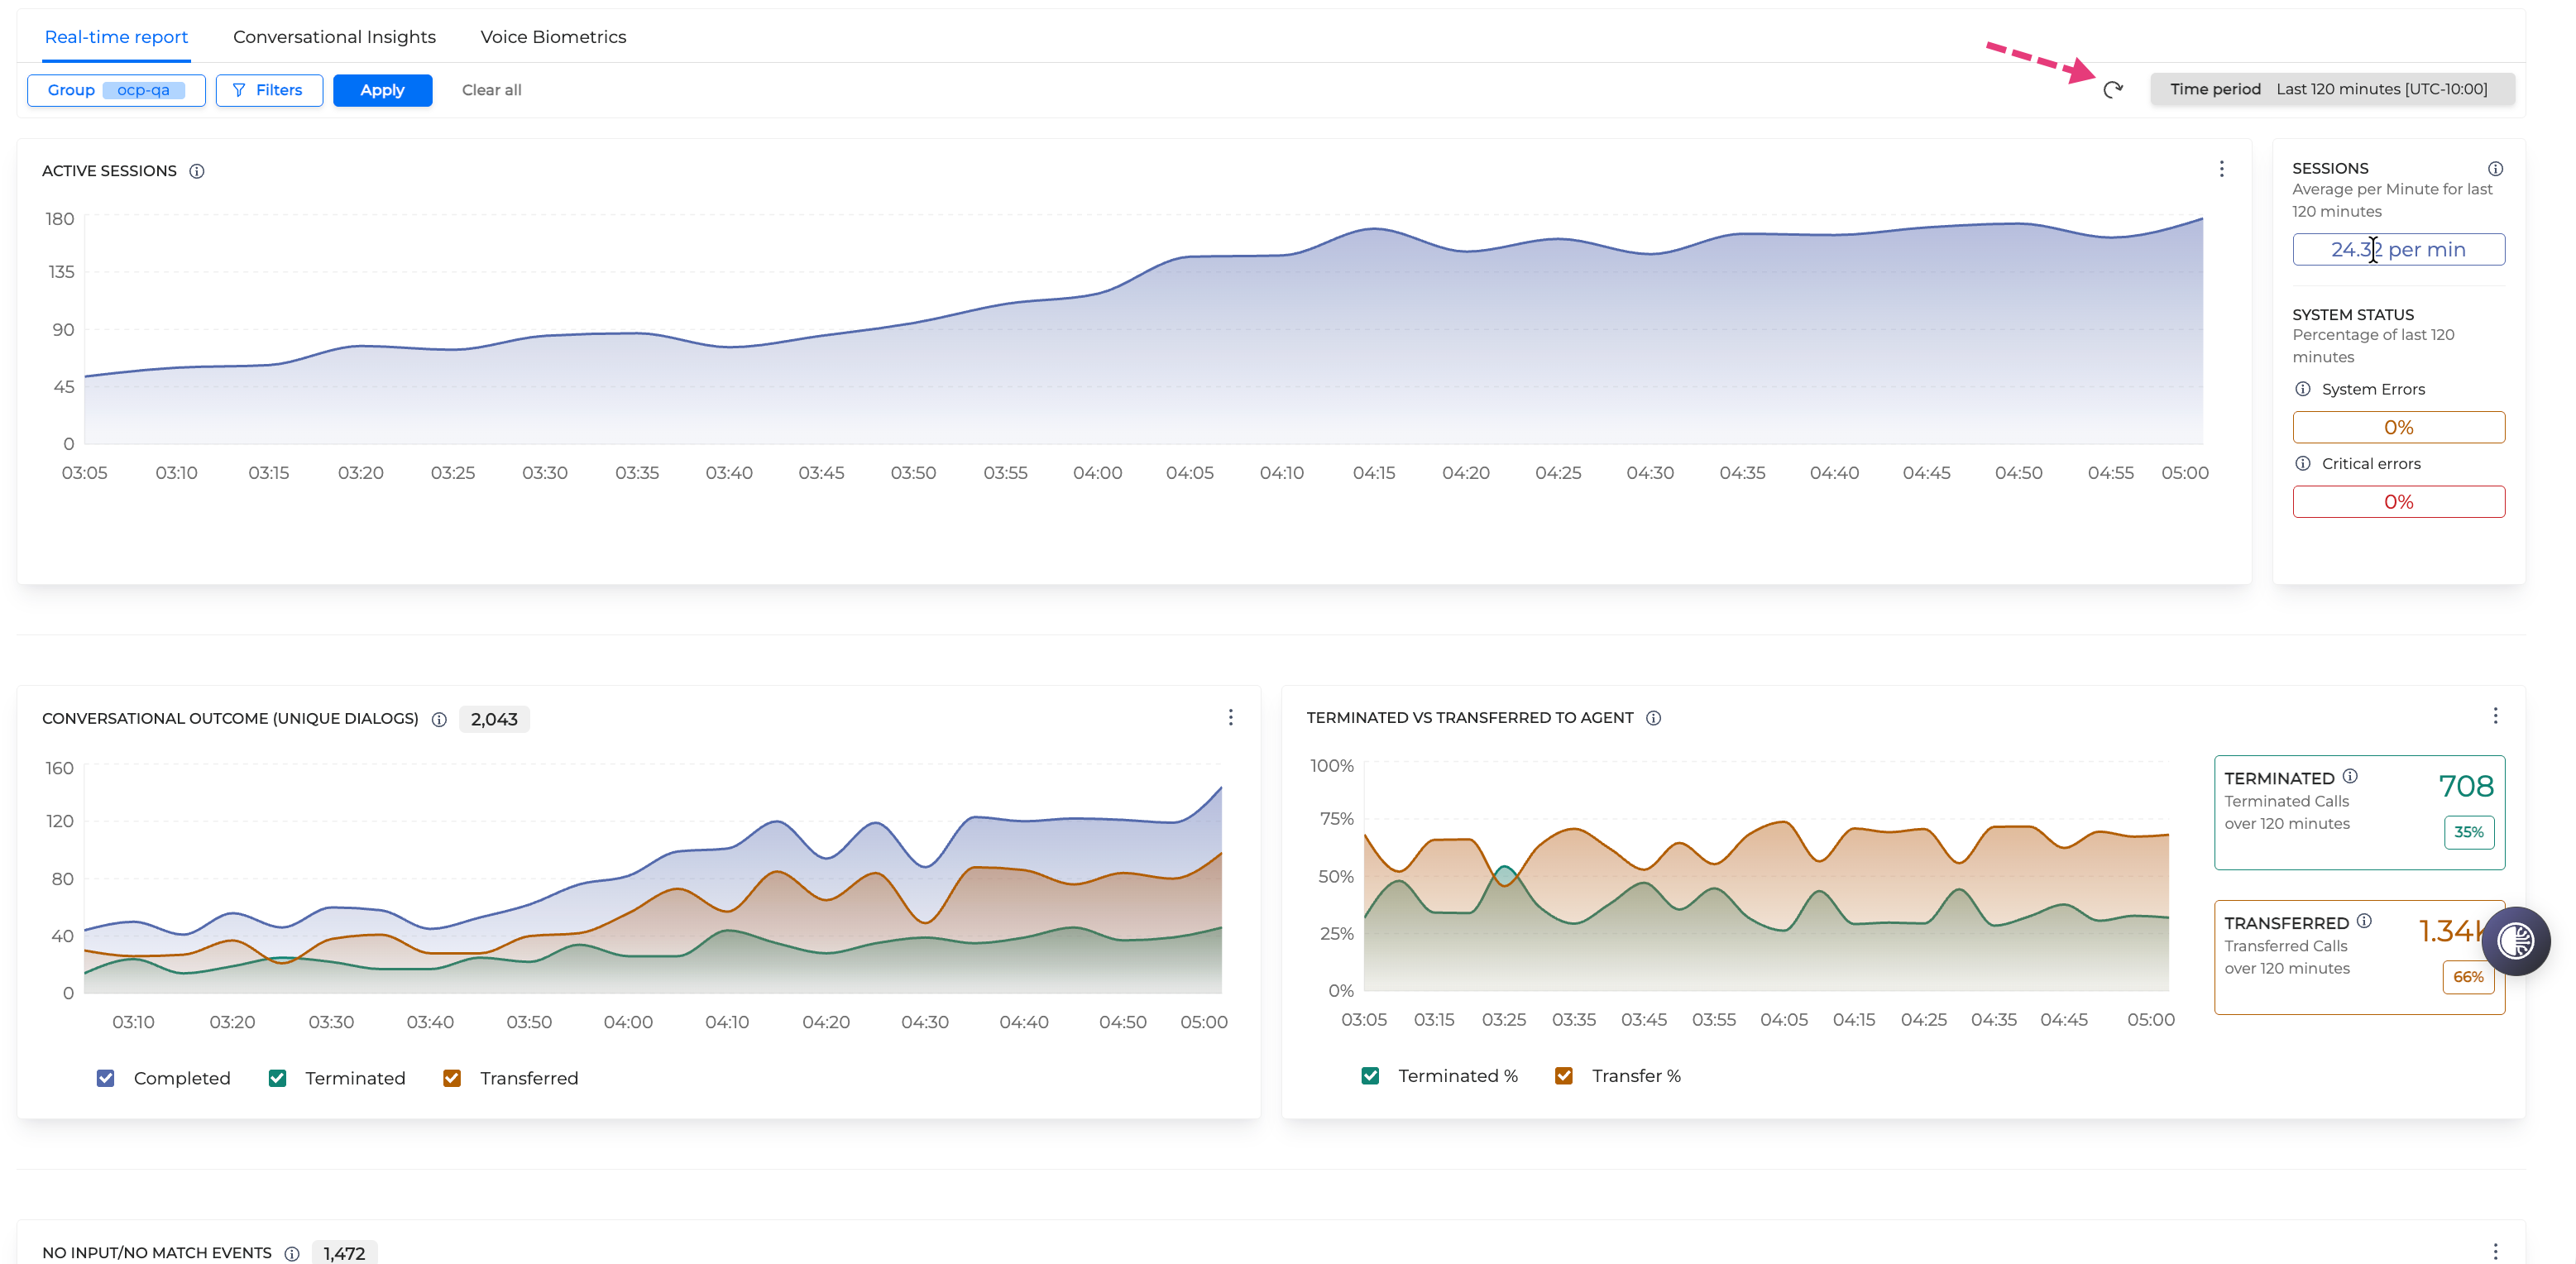
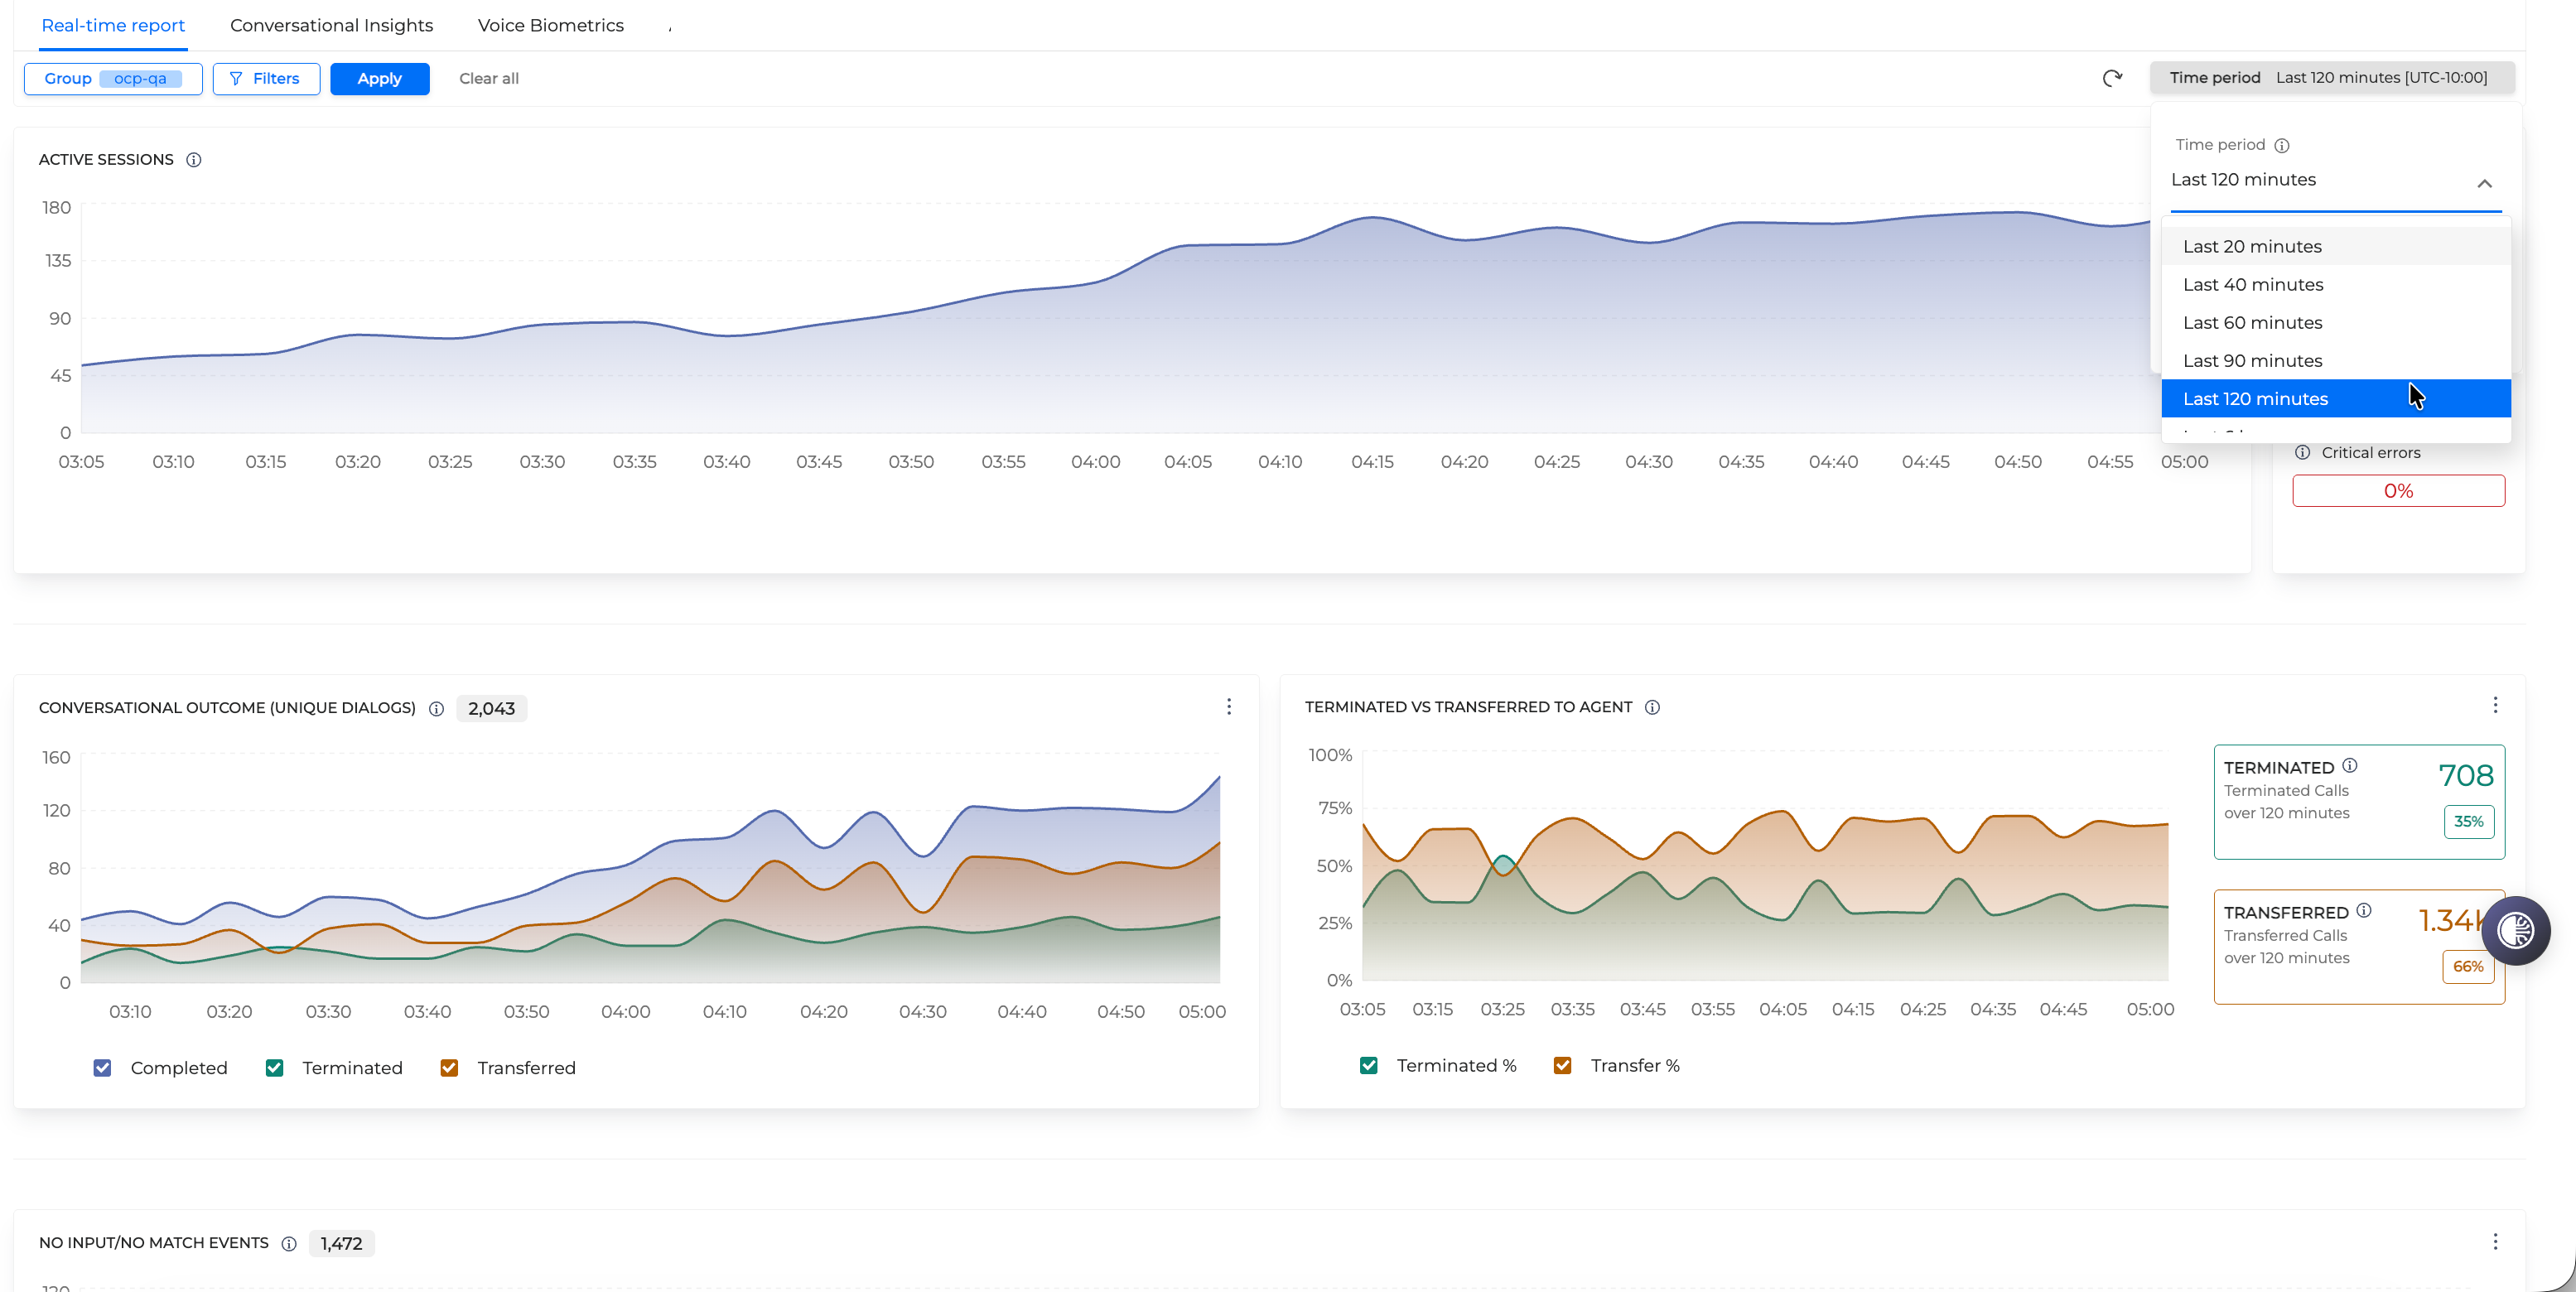
The default Time period for the data displayed is Last 120 minutes. However, by clicking on the Time period dropdown, you can select from predefined time period options ranging from Last 20 minutes to Last 48 hours.
Real-time report graphs
The following information is available in the Real-time report tab:
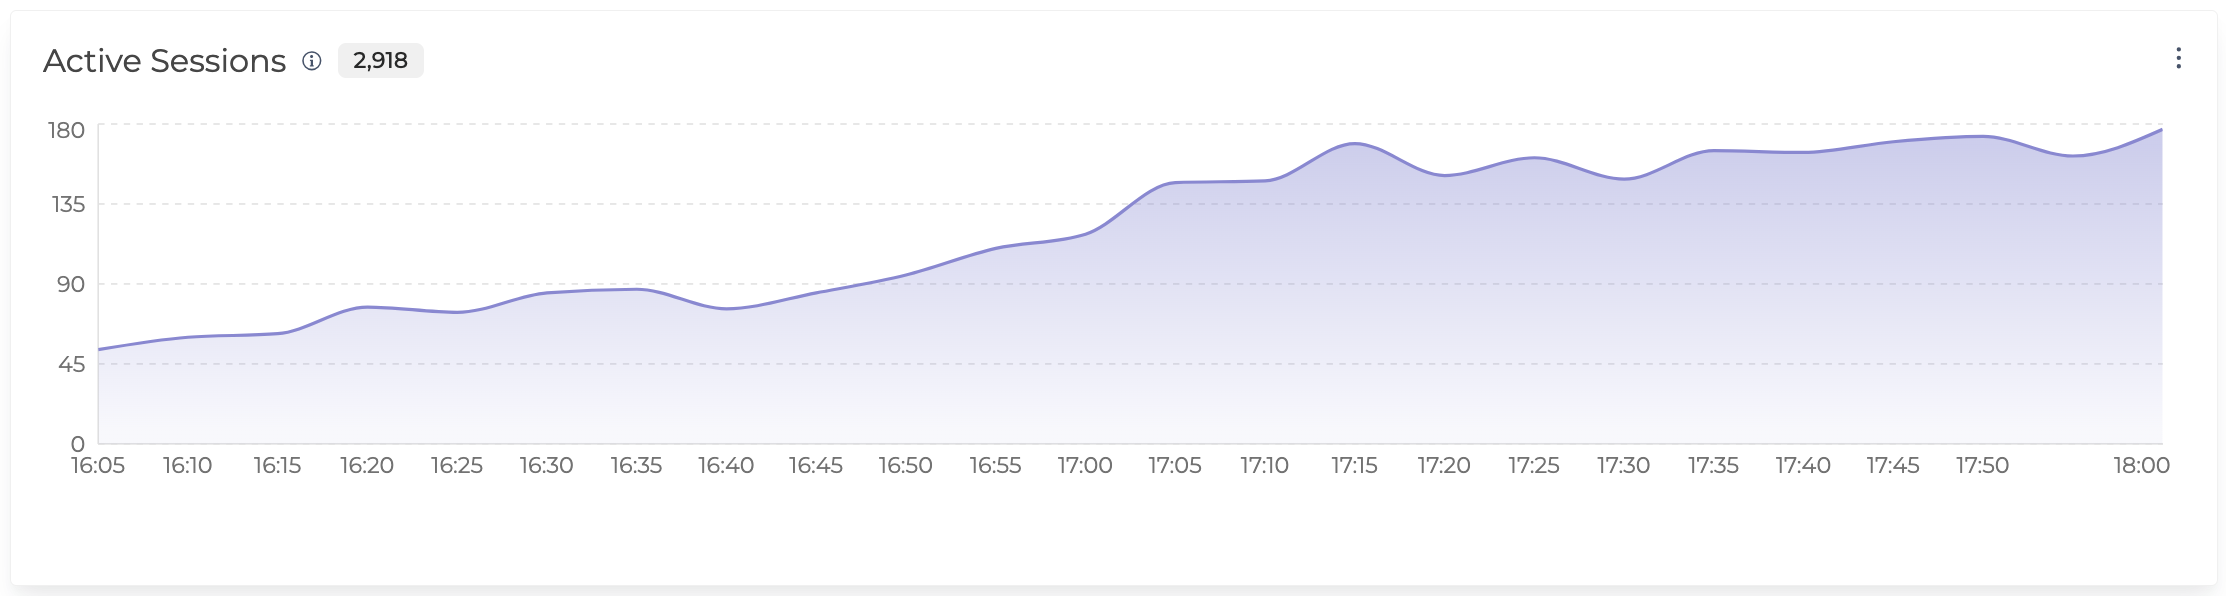
Active Sessions
The Active Sessions report shows the number of distinct sessions the application received.
Sessions refer to either the number of unique IVR calls or chat sessions (depending on the application), no matter how many miniApps or Orchestrator Flows were triggered. For the session counter to increase, at least one miniApp must be triggered within OCP®.
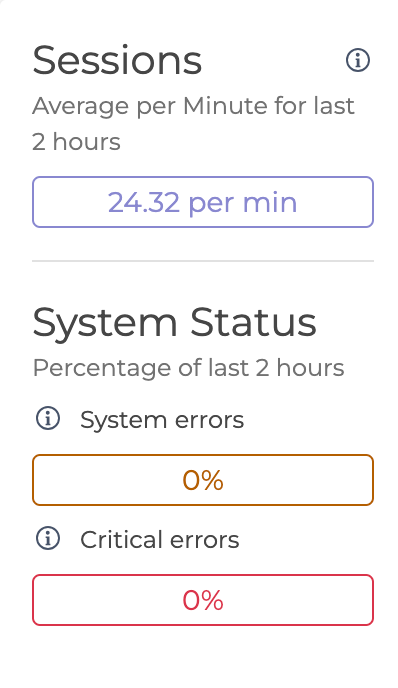
Average Sessions & System Status
The Sessions panel of the right to the Active Sessions report shows the average number of sessions per minute that the application received for the last 2 hours (by default). If you change the time period in the Time period dropdown, the time frame of this panel will update accordingly.
The System Status panel displays the percentage of system and critical errors over total tasks of the last 2 hours (by default). If you change the time period in the Time period dropdown, the time frame of this panel will update accordingly.
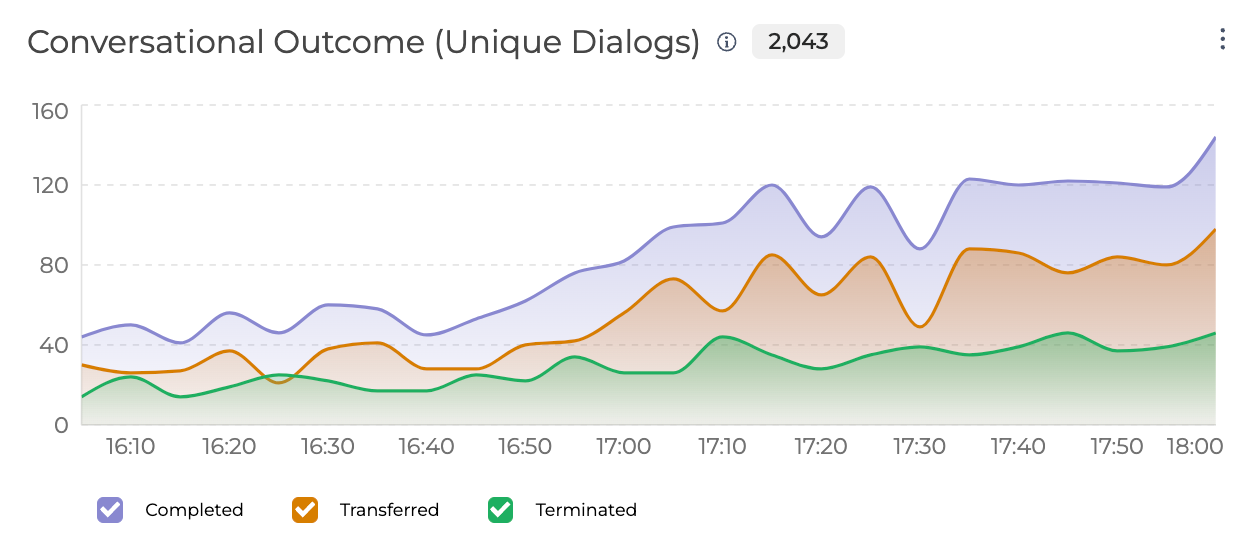
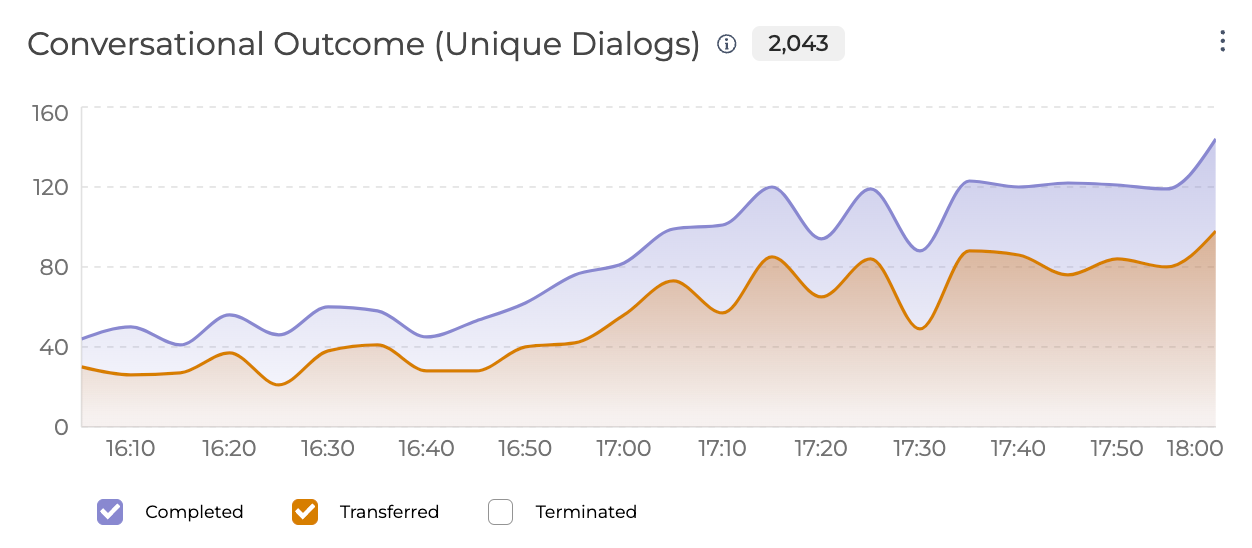
Conversational Outcome (Unique Dialogs)
The Conversational Outcome (Unique Dialogs) report is applicable for Orchestrator applications and refers to the number of dialogs per Orchestrator application. A dialog is a unique conversation (call or chat) within an OCP® application.
The following metrics are available:
-
Completed: Number of completed dialogs. Includes both terminated and transferred dialogs, as well as edge cases, when the dialog end is unknown.
-
Transferred: Total number of dialogs that got transferred to a live agent.
-
Terminated: Total number of dialogs that got terminated by the user or the system.
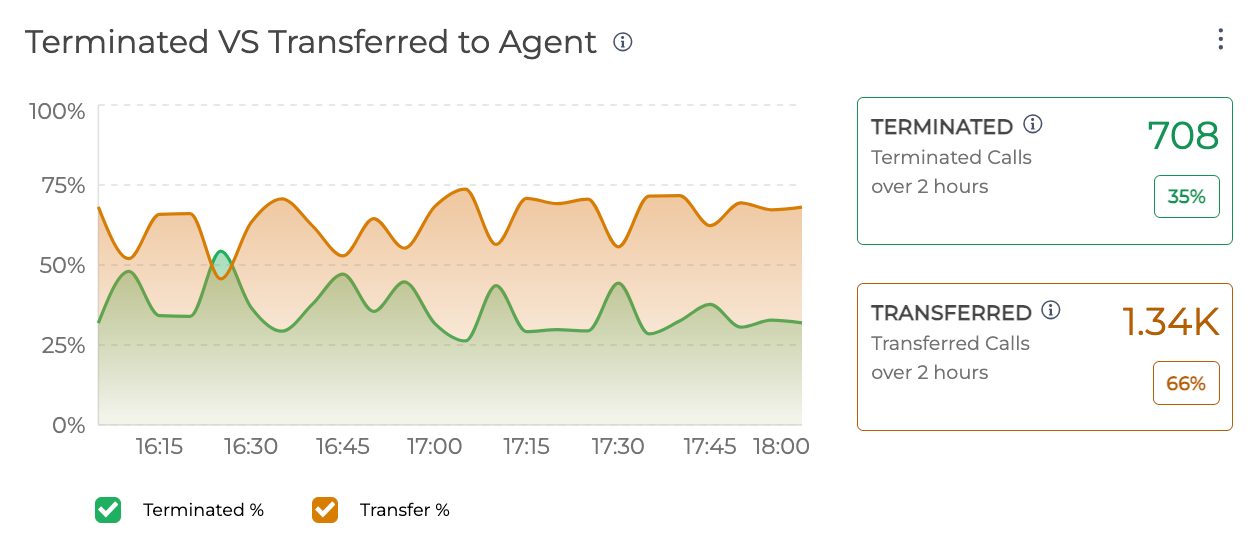
Terminated VS Transferred to Agent
The Terminated VS Transferred to Agent report displays a number of dialog termination and transfer rates over total calls of the last 2 hours (by default). If you change the time period in the Time period dropdown, the time frame of this panel will update accordingly.
-
Terminated: Total number or terminated calls, including both user and system termination. The percentage below the total number of terminated calls shows the termination rate over total call volume within the selected time frame.
-
Transferred: Total number of transferred calls outside of IVR. The percentage below the total number of transferred calls shows the transfer rate over total call volume within the selected time frame.
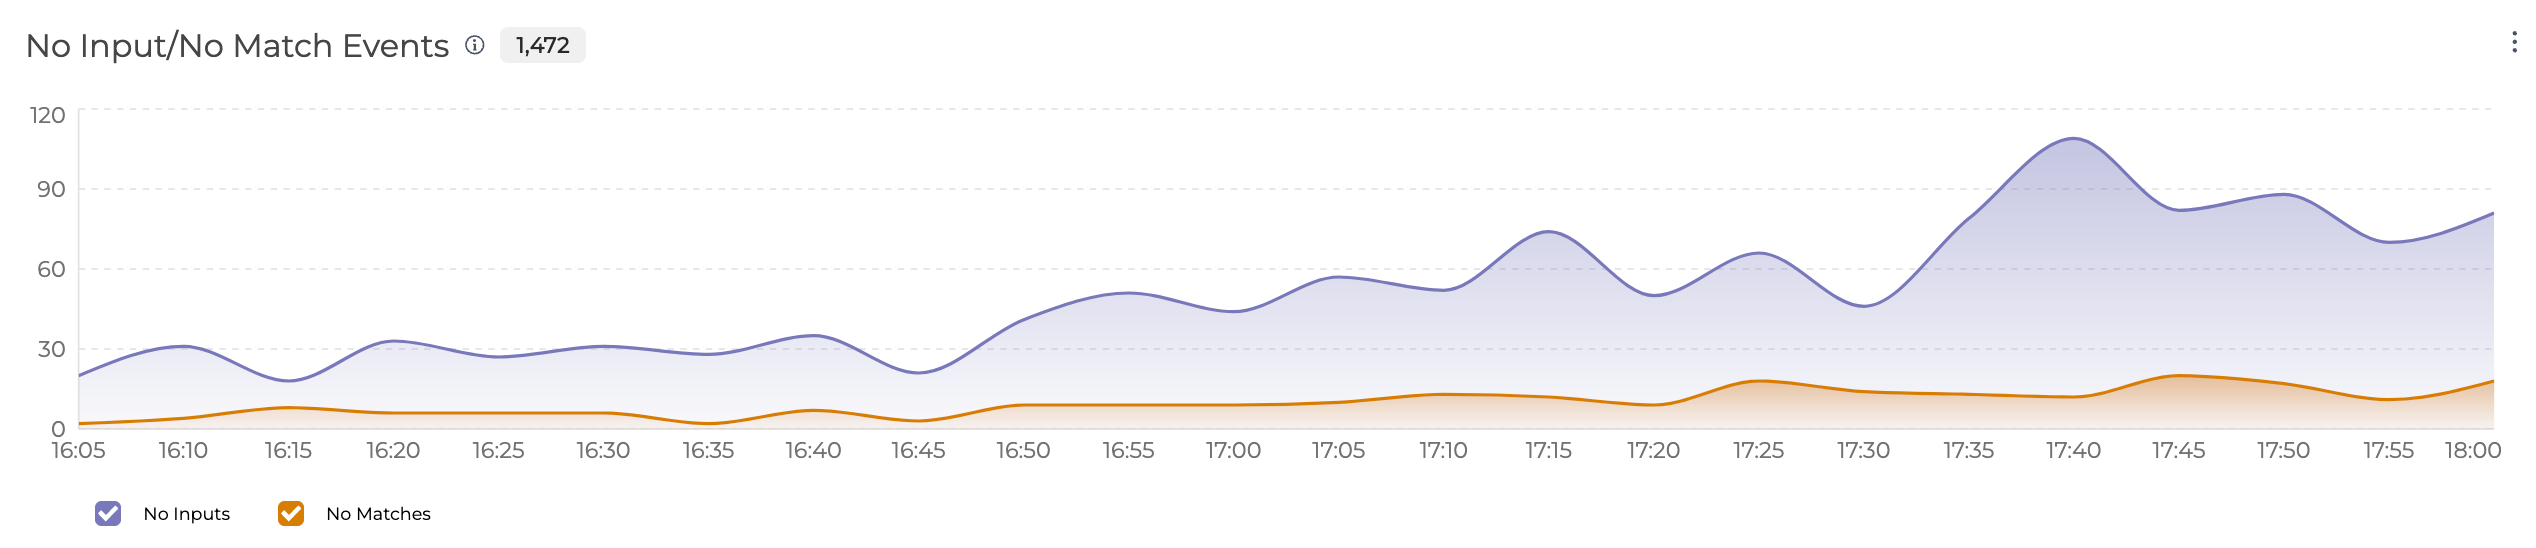
No Input/No Match Events
The No Input/No Match Events report displays a total number of No Inputs and No Matches per miniApp.
No Inputs and No Matches are applicable only for those miniApps that expect a user input.
-
No Inputs: Total number of steps with no input. A single miniApp may have multiple steps with no inputs. This is a per-step metric.
-
No Matches: Total number of steps with no match. A single miniApp may have multiple steps with no matches. This is a per-step metric.
Total Tasks (miniApps)
The Total Tasks (miniApps) report is applicable for OCP® miniApp applications. Each counter is increased after the compilation of each miniApp task.
The following metrics are available:
-
Total: The number of total invocations (tasks) originating from miniApps. This includes successful miniApps, miniApps that ended with system errors and critical errors, as well as miniApps that ended with any other failed reason like user termination or invalid input.
-
Successful: The number of total successful miniApps invocations.
-
System Errors: The number of invocations ended with a system error or a timeout error.
-
Critical Error: The number of invocations ended with a critical error. A critical error may affect one or multiple Applications within the same call.
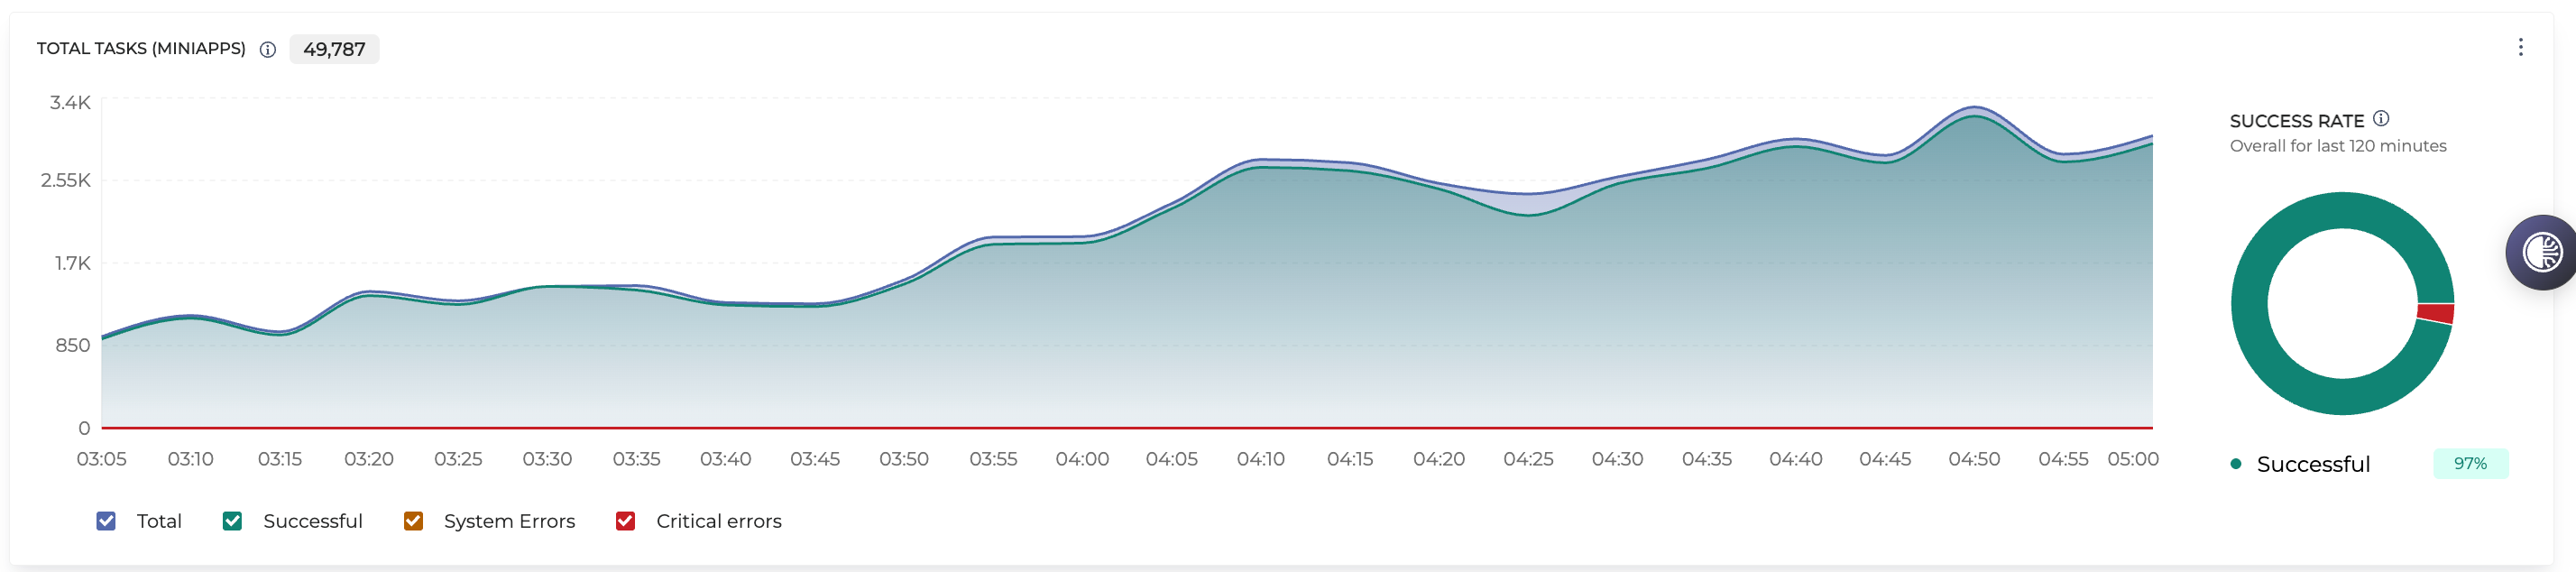
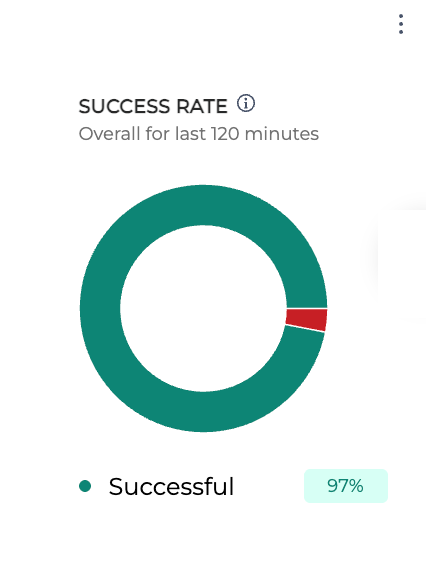
miniApp Success rate
To the right of the Total Tasks (miniApps) graph you can find a Success Rate graph for last 2 hours (by default). If you change the time period in the Time period dropdown, the time frame of this panel will update accordingly.
The Success Rate graph displays the percentage of successful invocations of miniApps (green) over the total miniApp invocations.
The Successful metric highlights the percentage of successful miniApp invocations over the total number of miniApp invocations.
Keep in mind unsuccessful miniApps are not only errors but cases where could be a business failure, early hang ups, etc.
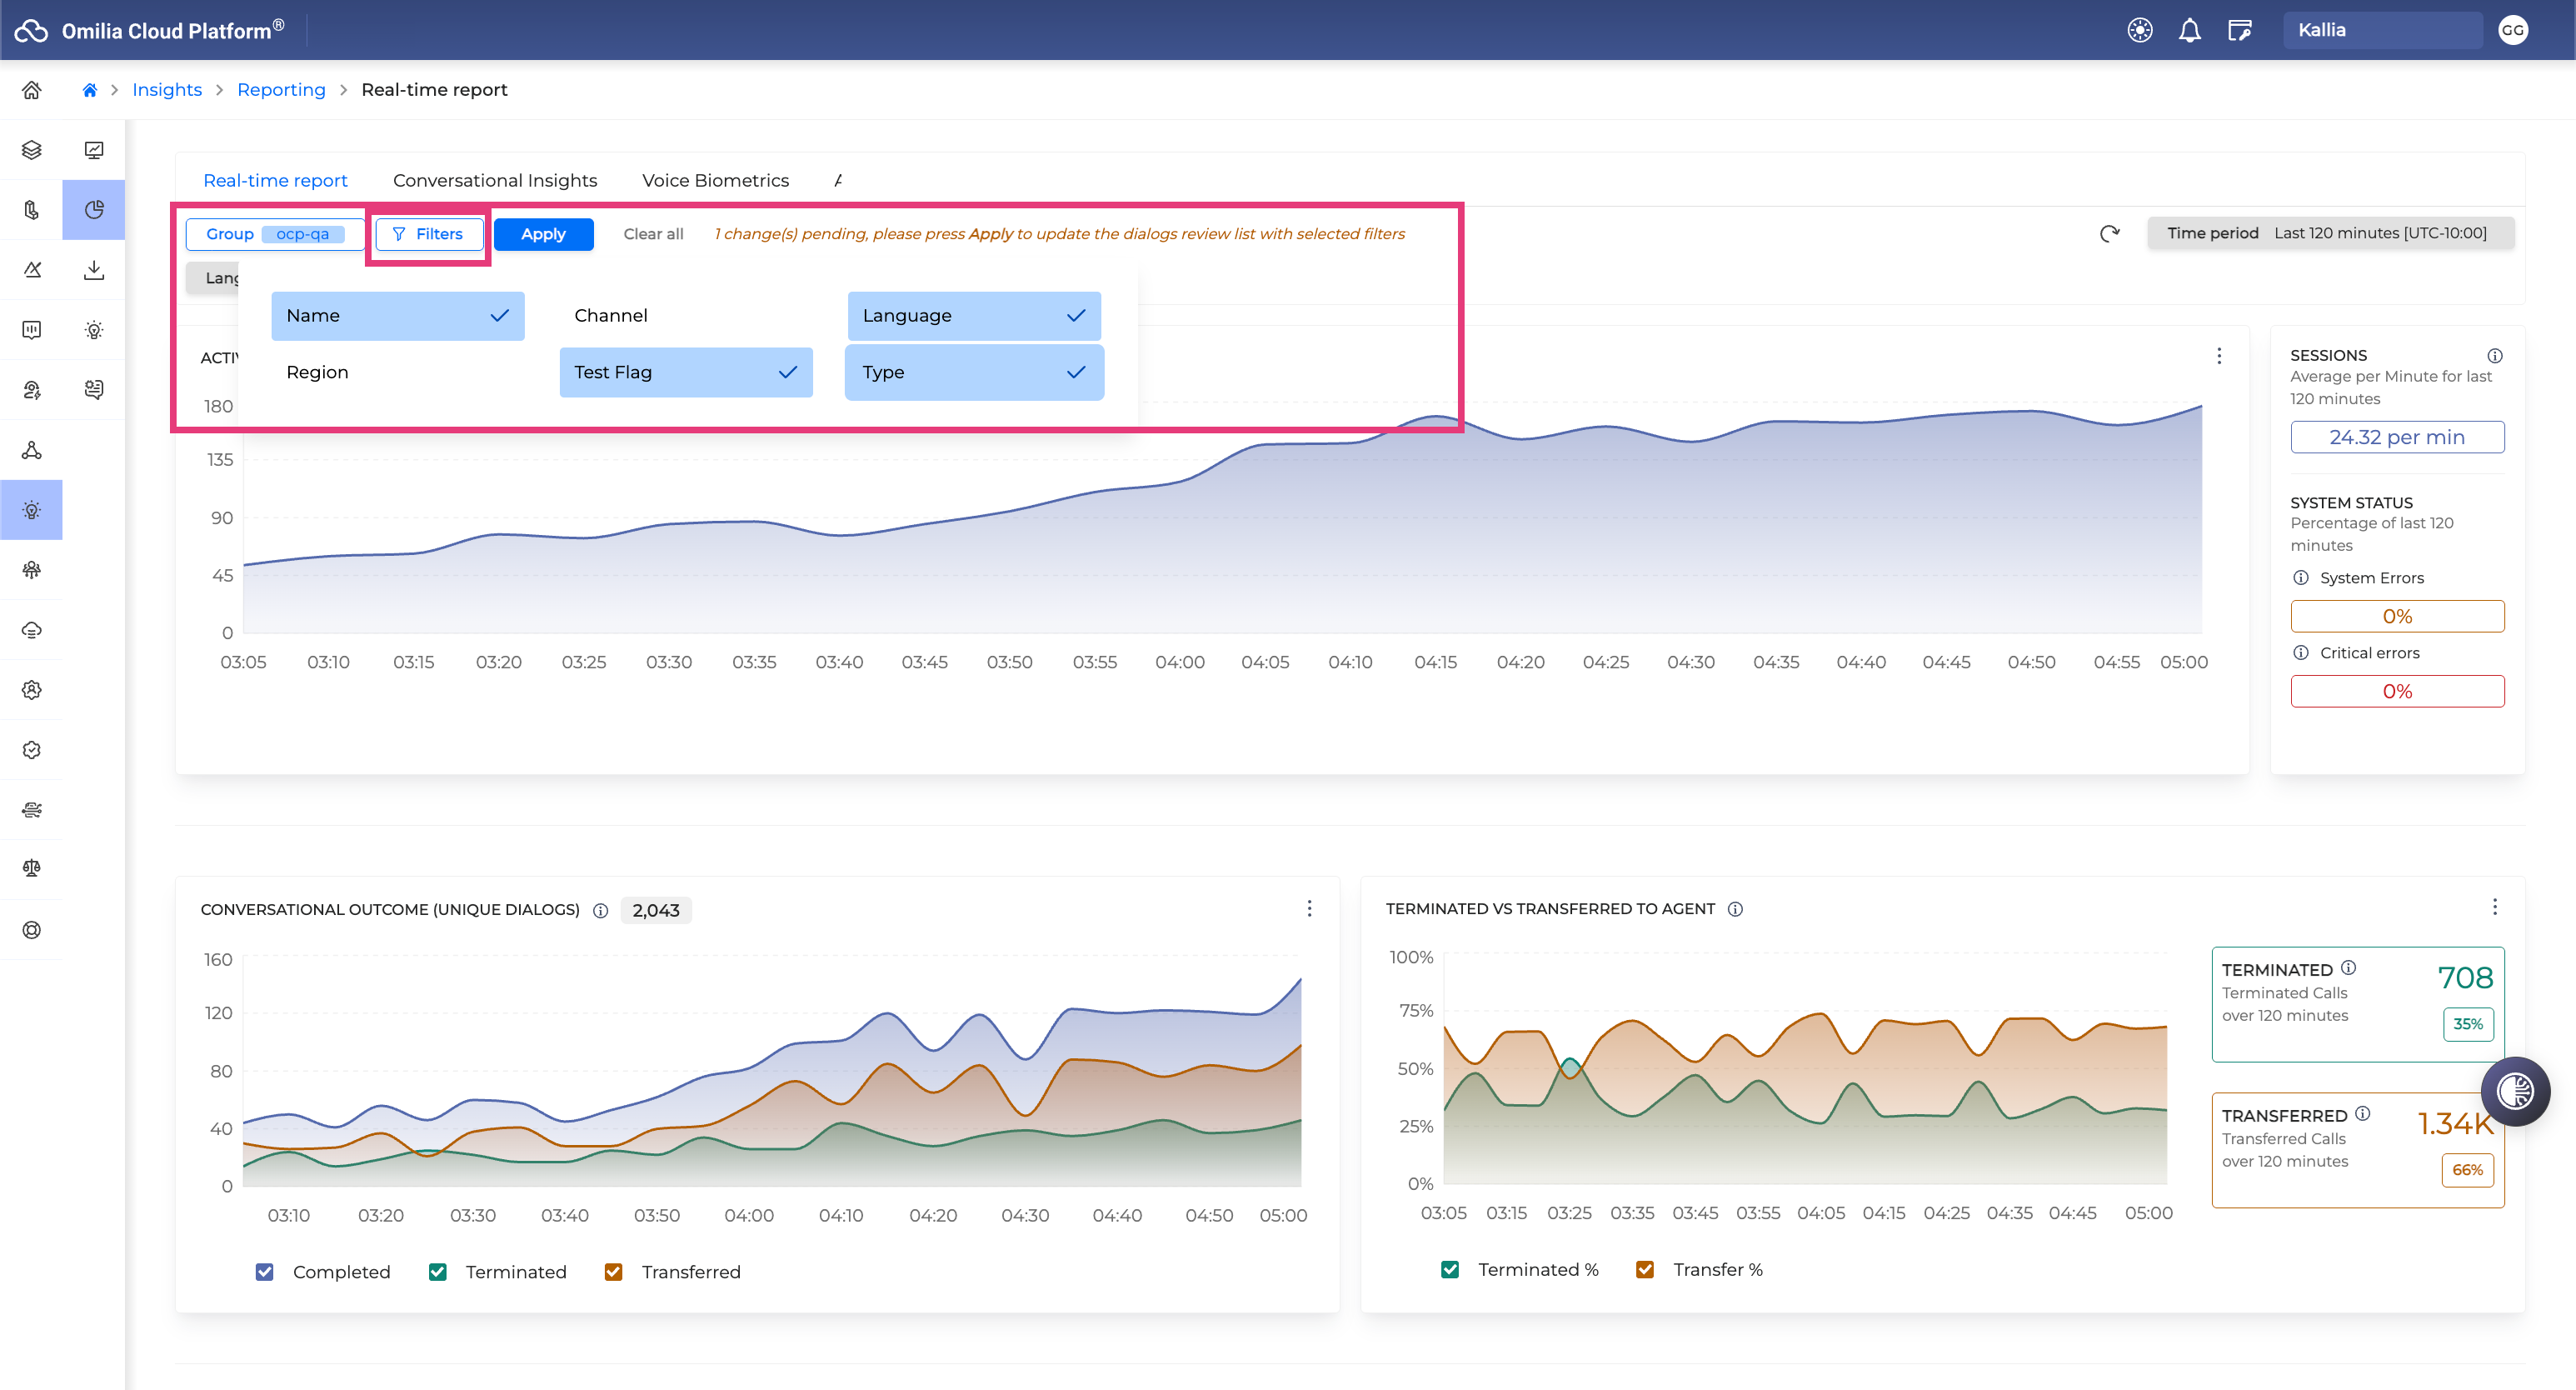
Real-time report filters
The data results for real-time data are based on the filters set in the Filters menu. The search filter allows you to easily target specific applications or miniApps within OCP®.
Not all filters are applicable for all reports!
Note that the Time period filter is now available near the Filters button, outside the search filters menu, for easier access.
To open the search filters, proceed as follows:
-
Click the Filters button, select the filters you want to pin and click the Apply button.
-
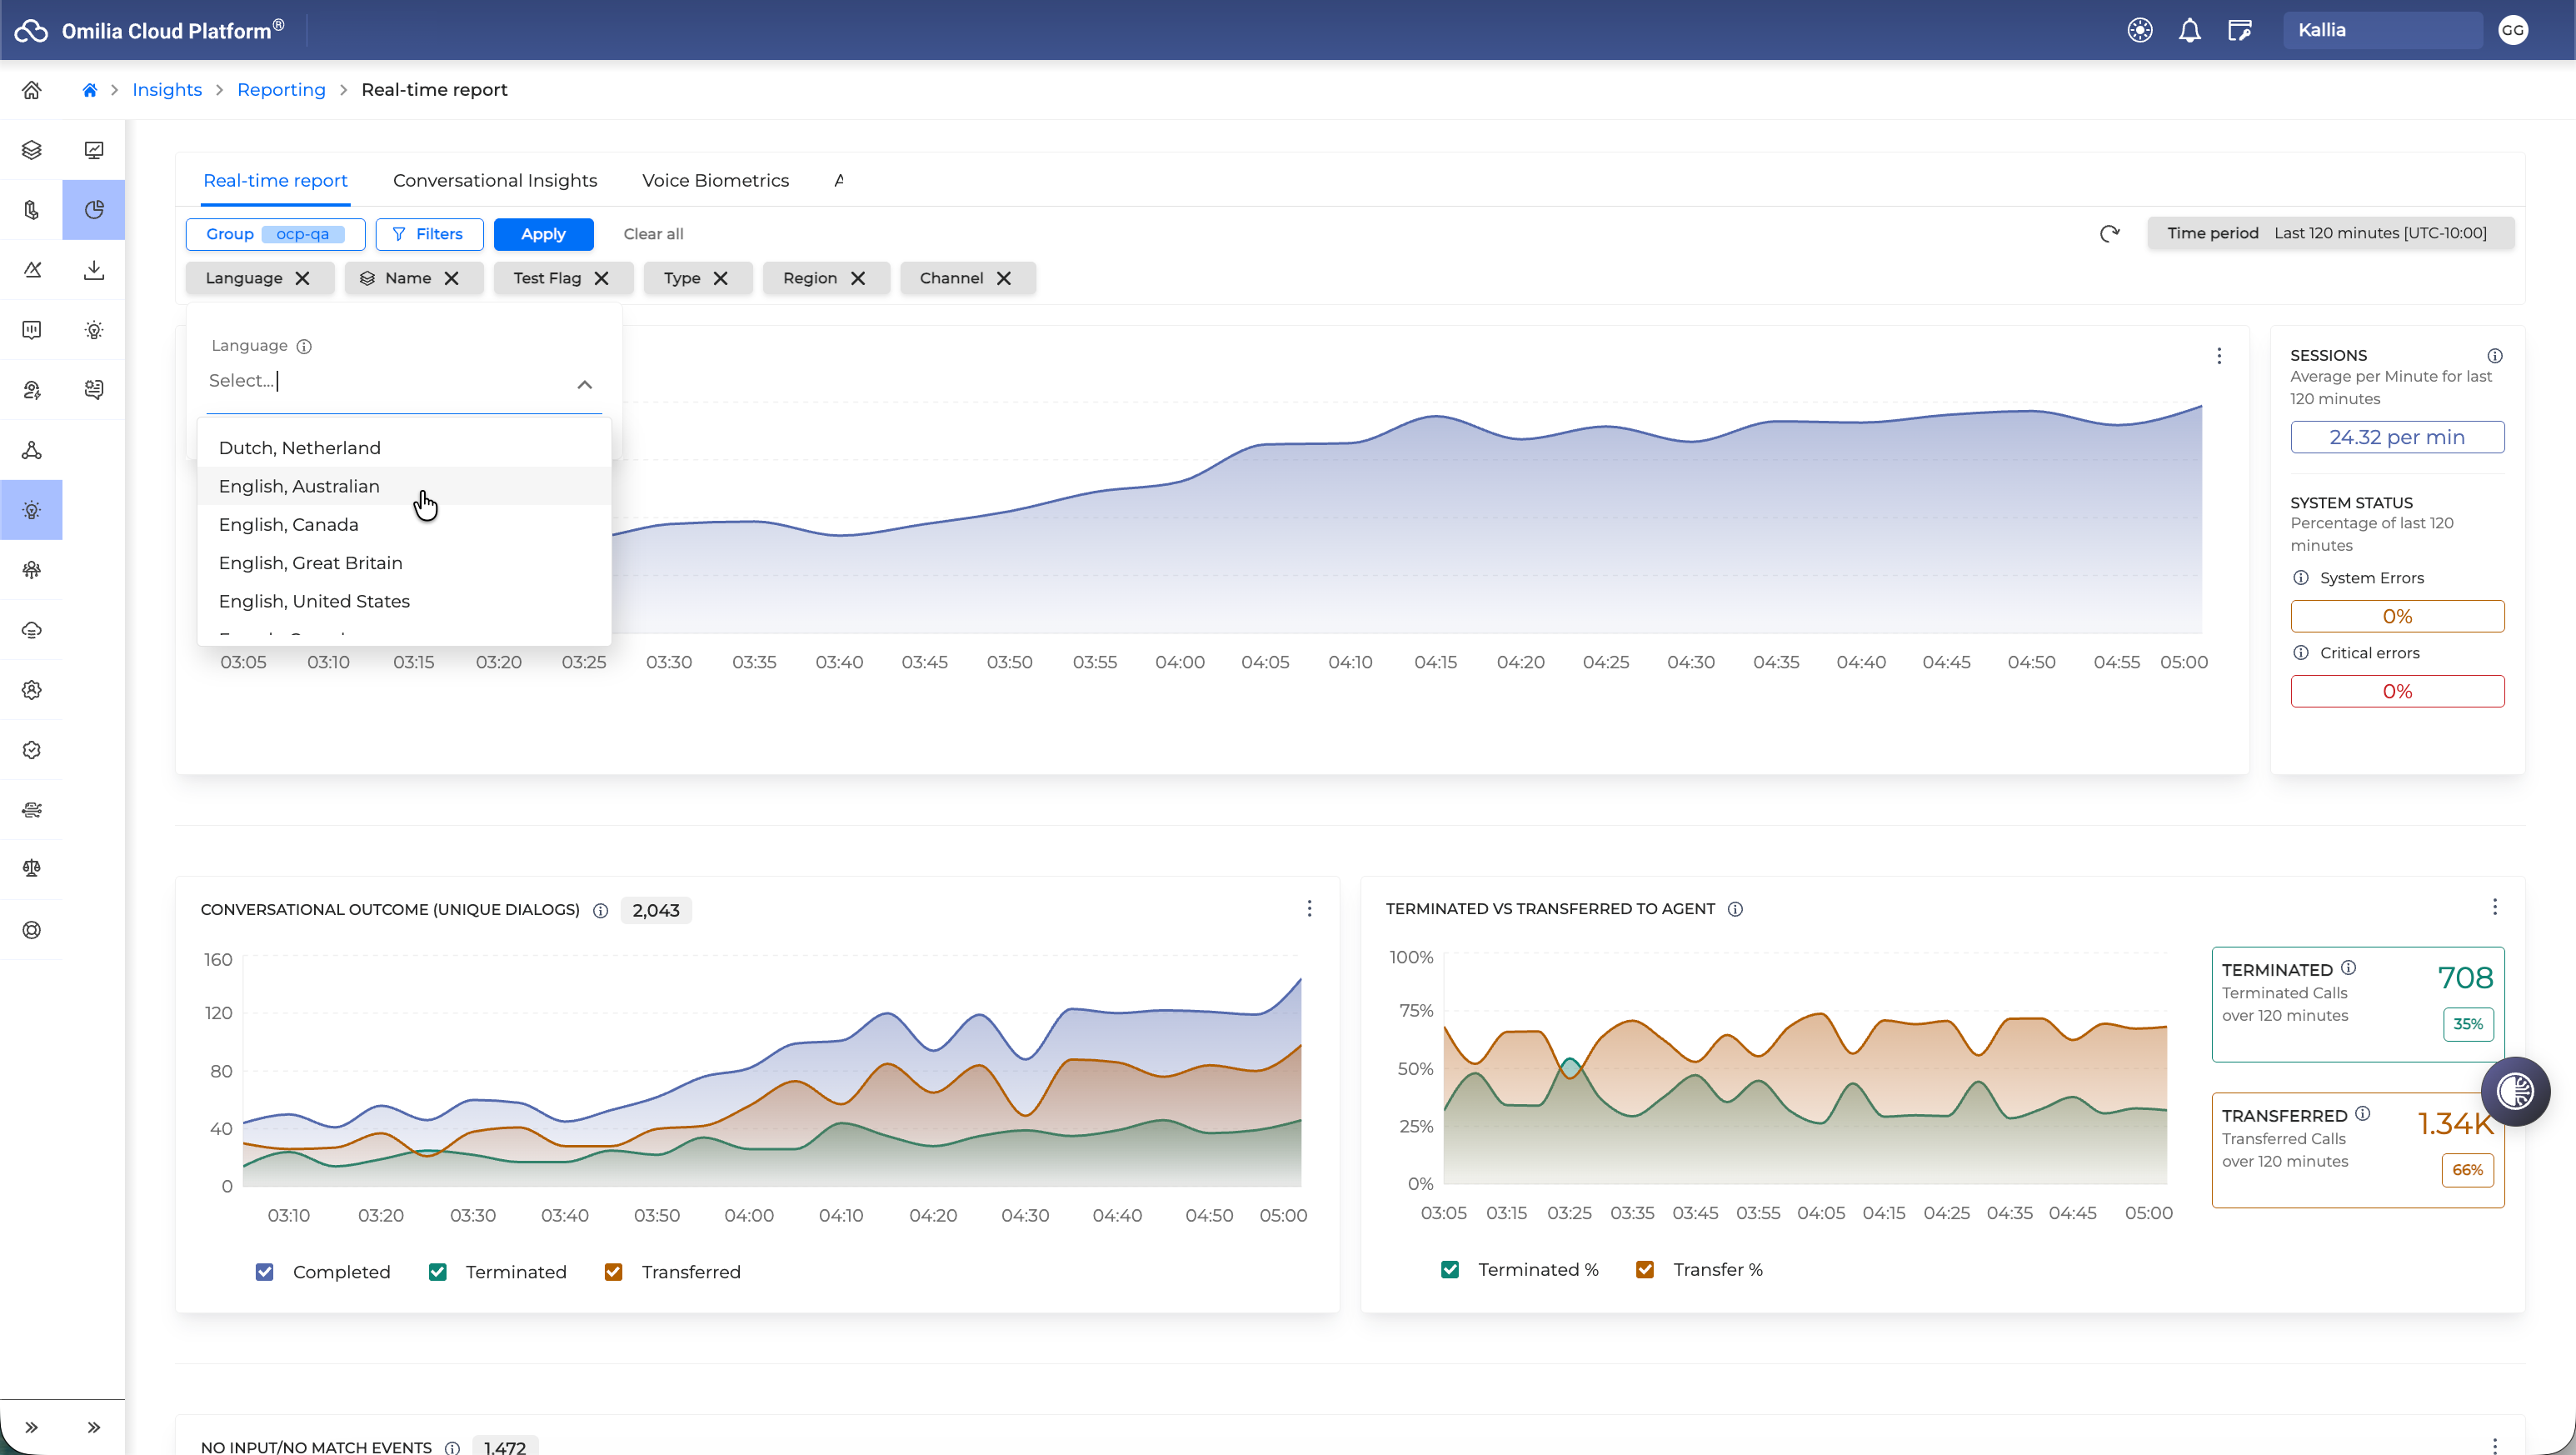
Each pinned filter has a dropdown list of available options. Fill in the search filter fields as per your needs.
-
Group: The OCP group that the metrics refer to. Only one group may be selected each time.
-
Name: The name of the miniApp for the miniApp Invocations report or Orchestrator application for the Dialogs report.
-
Channel: The channel of the user system interaction (for example, Voice or Chat). Applicable for all reports.
-
Language: The selected language of the user system interaction (for example, English US).
-
Region: OCP Environment Origin Region.
-
Test Flag: Select true for fetching only test-flagged calls (or char sessions). To exclude test-flagged calls, select false. By default, all calls are reported. Applicable for all reports.
-
Type: The type of the miniApp shown in the reports. For Orchestrator applications, the type is always Flow. Not applicable for Session reports.
-
Click the Apply button to get the real-time data results.
-
Click the Clear All button to reset the filters. This will reset all search filter fields.
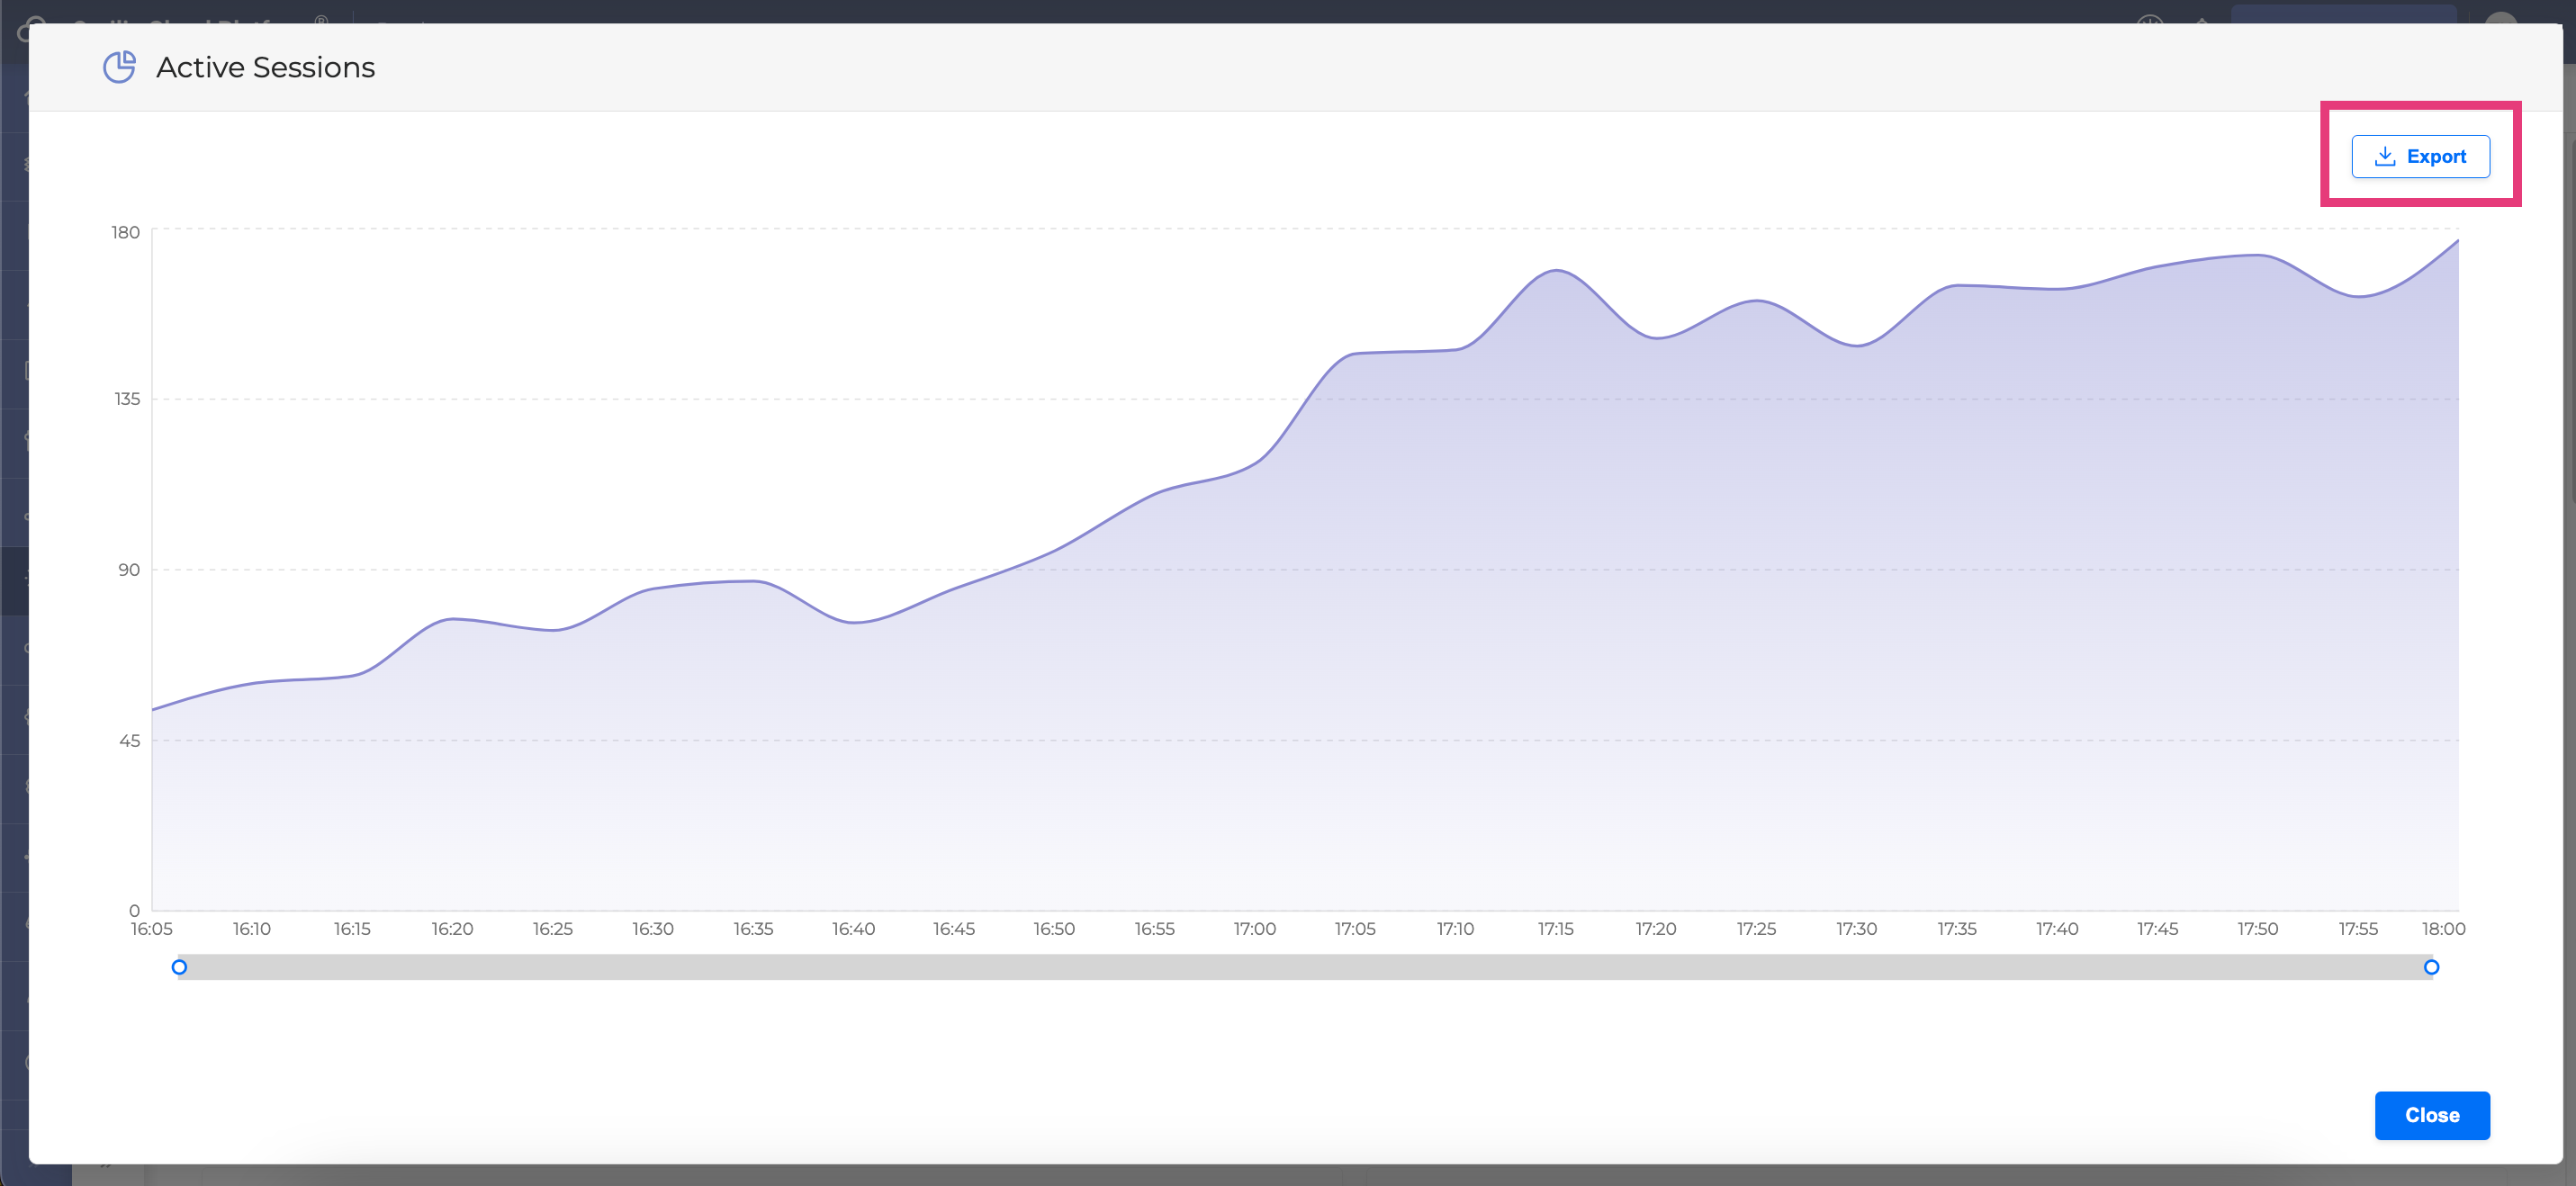
Viewing data in Full Screen mode
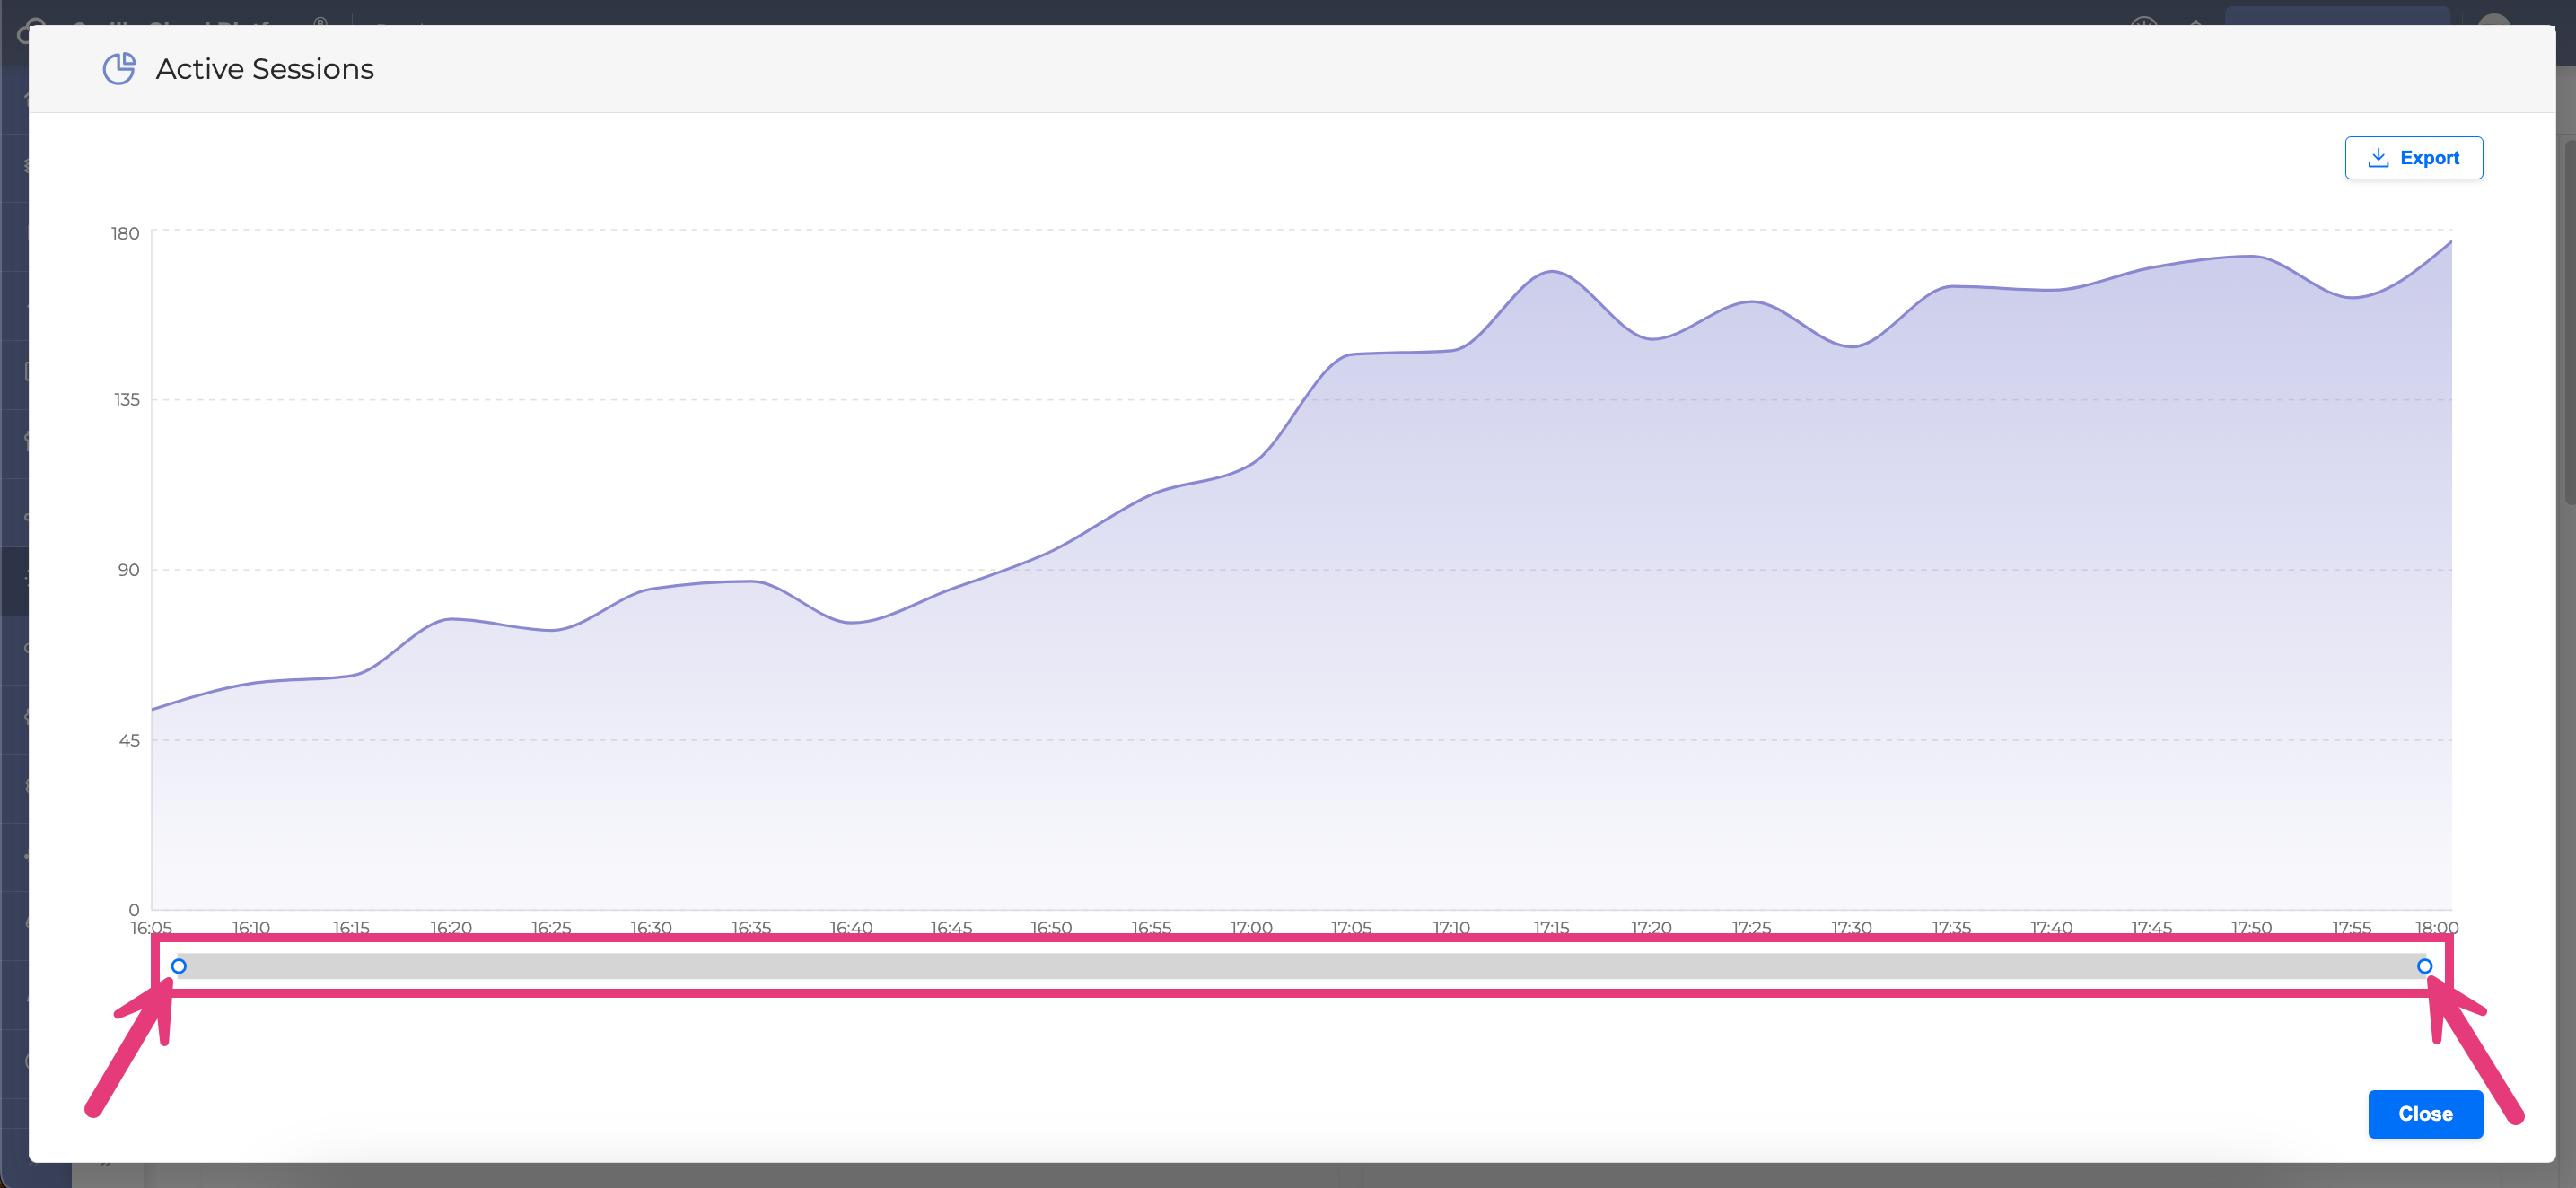
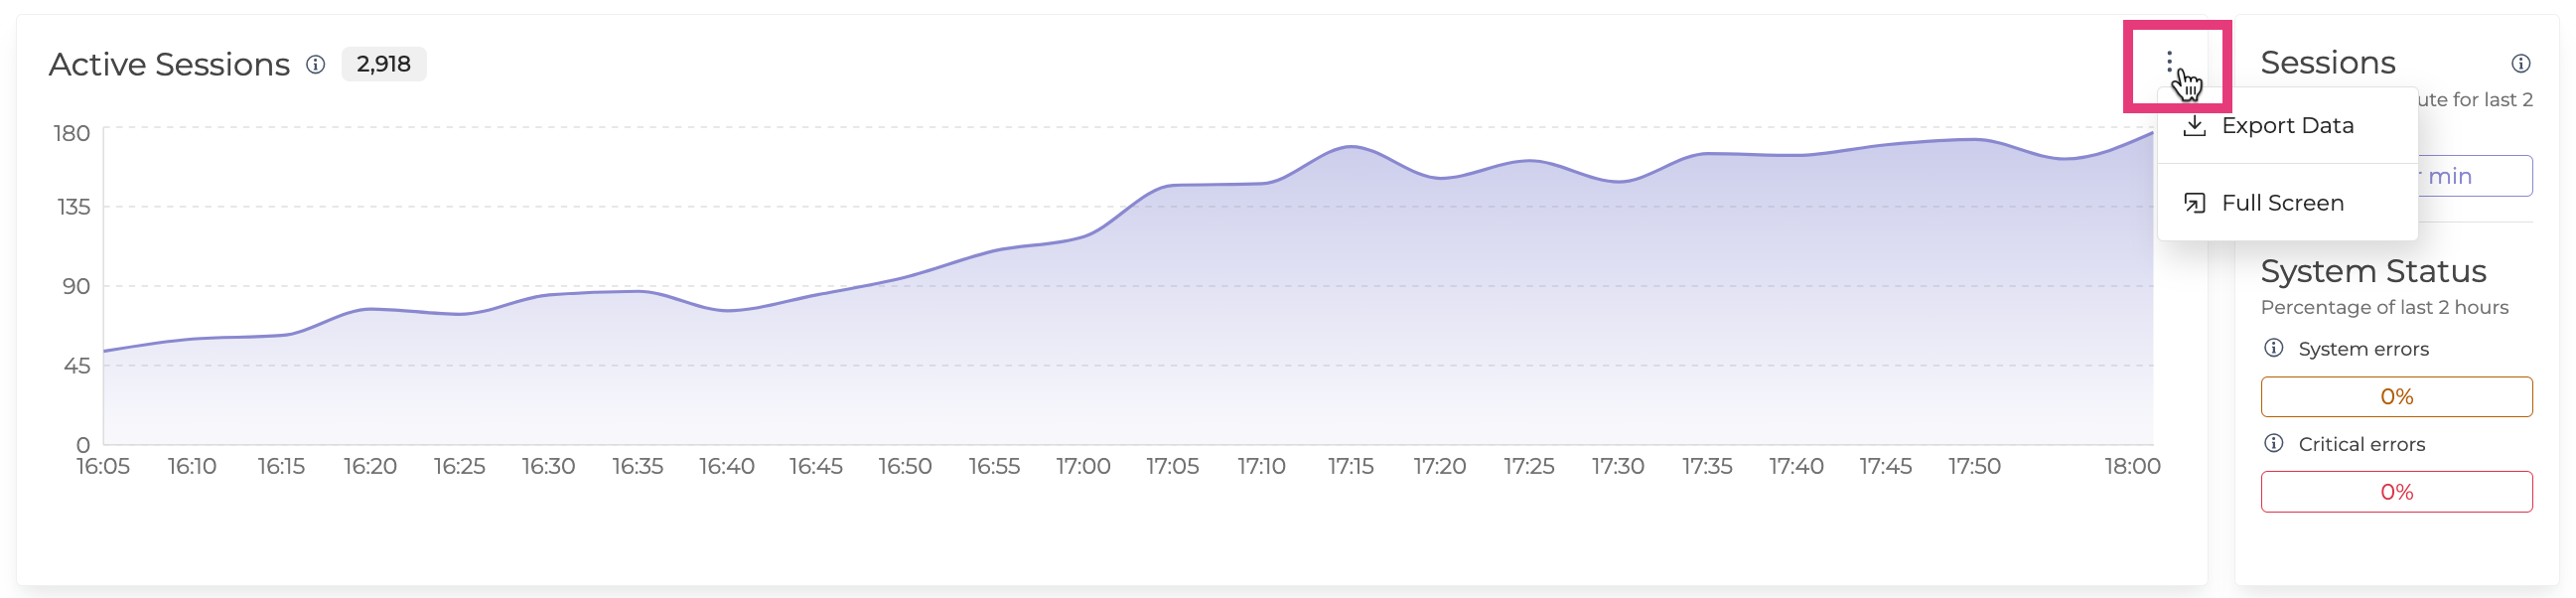
You can view any graph in the full-screen mode by clicking the Full Screen button next to each graph.

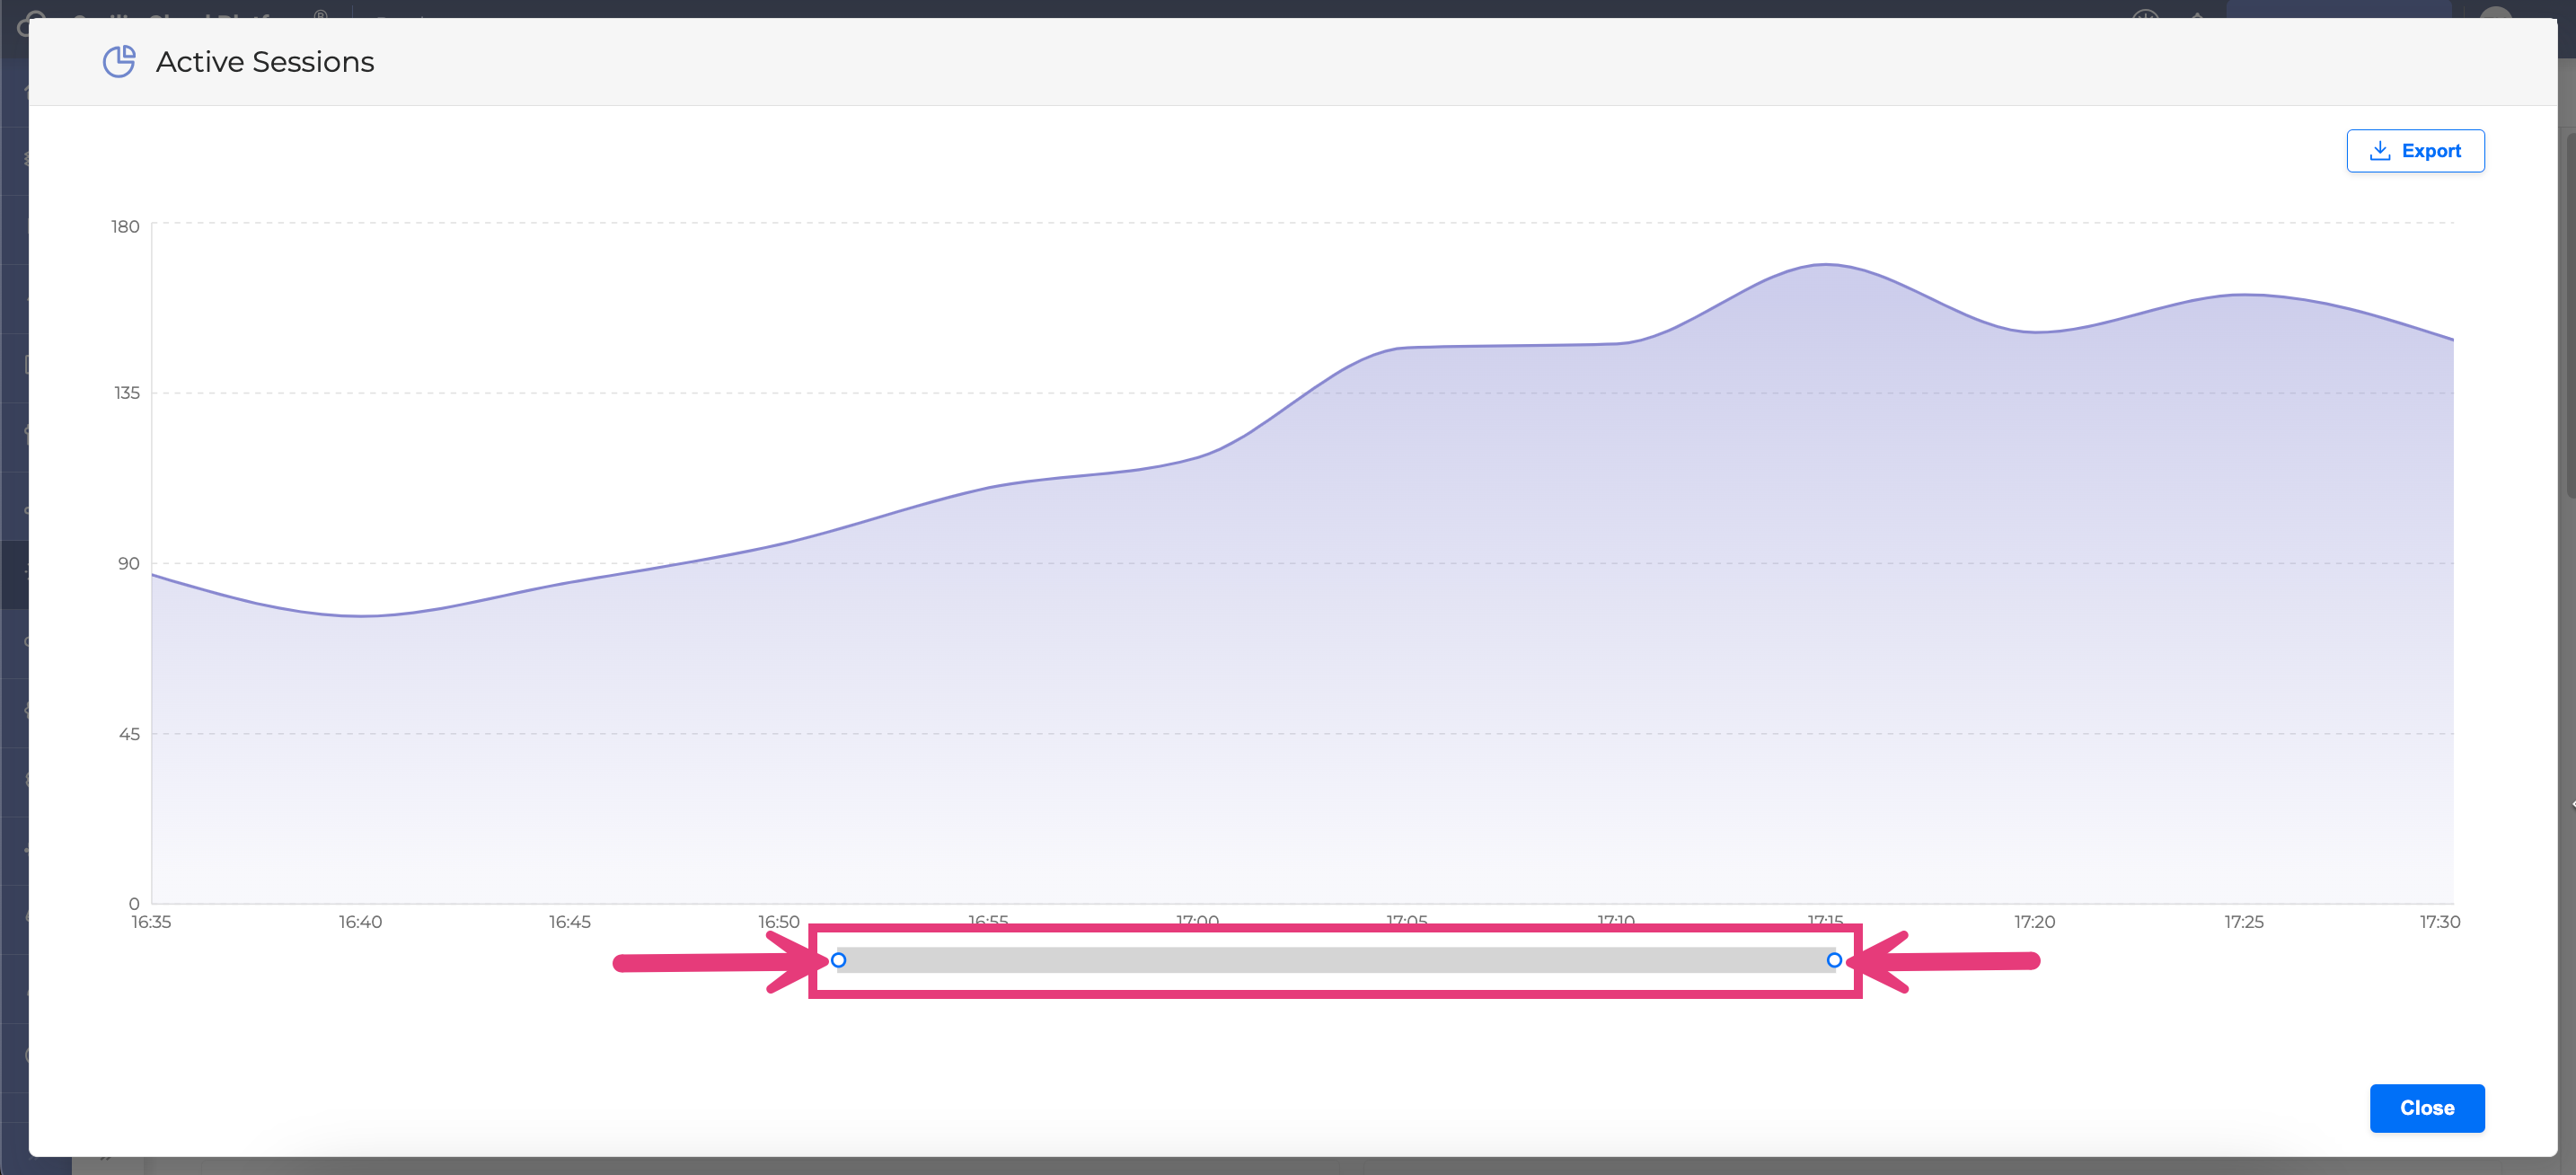
It is possible to narrow down the time frame displayed in the report viewed in the full-mode by clicking the blue dot at any end of the slider element and dragging it to the left or right.
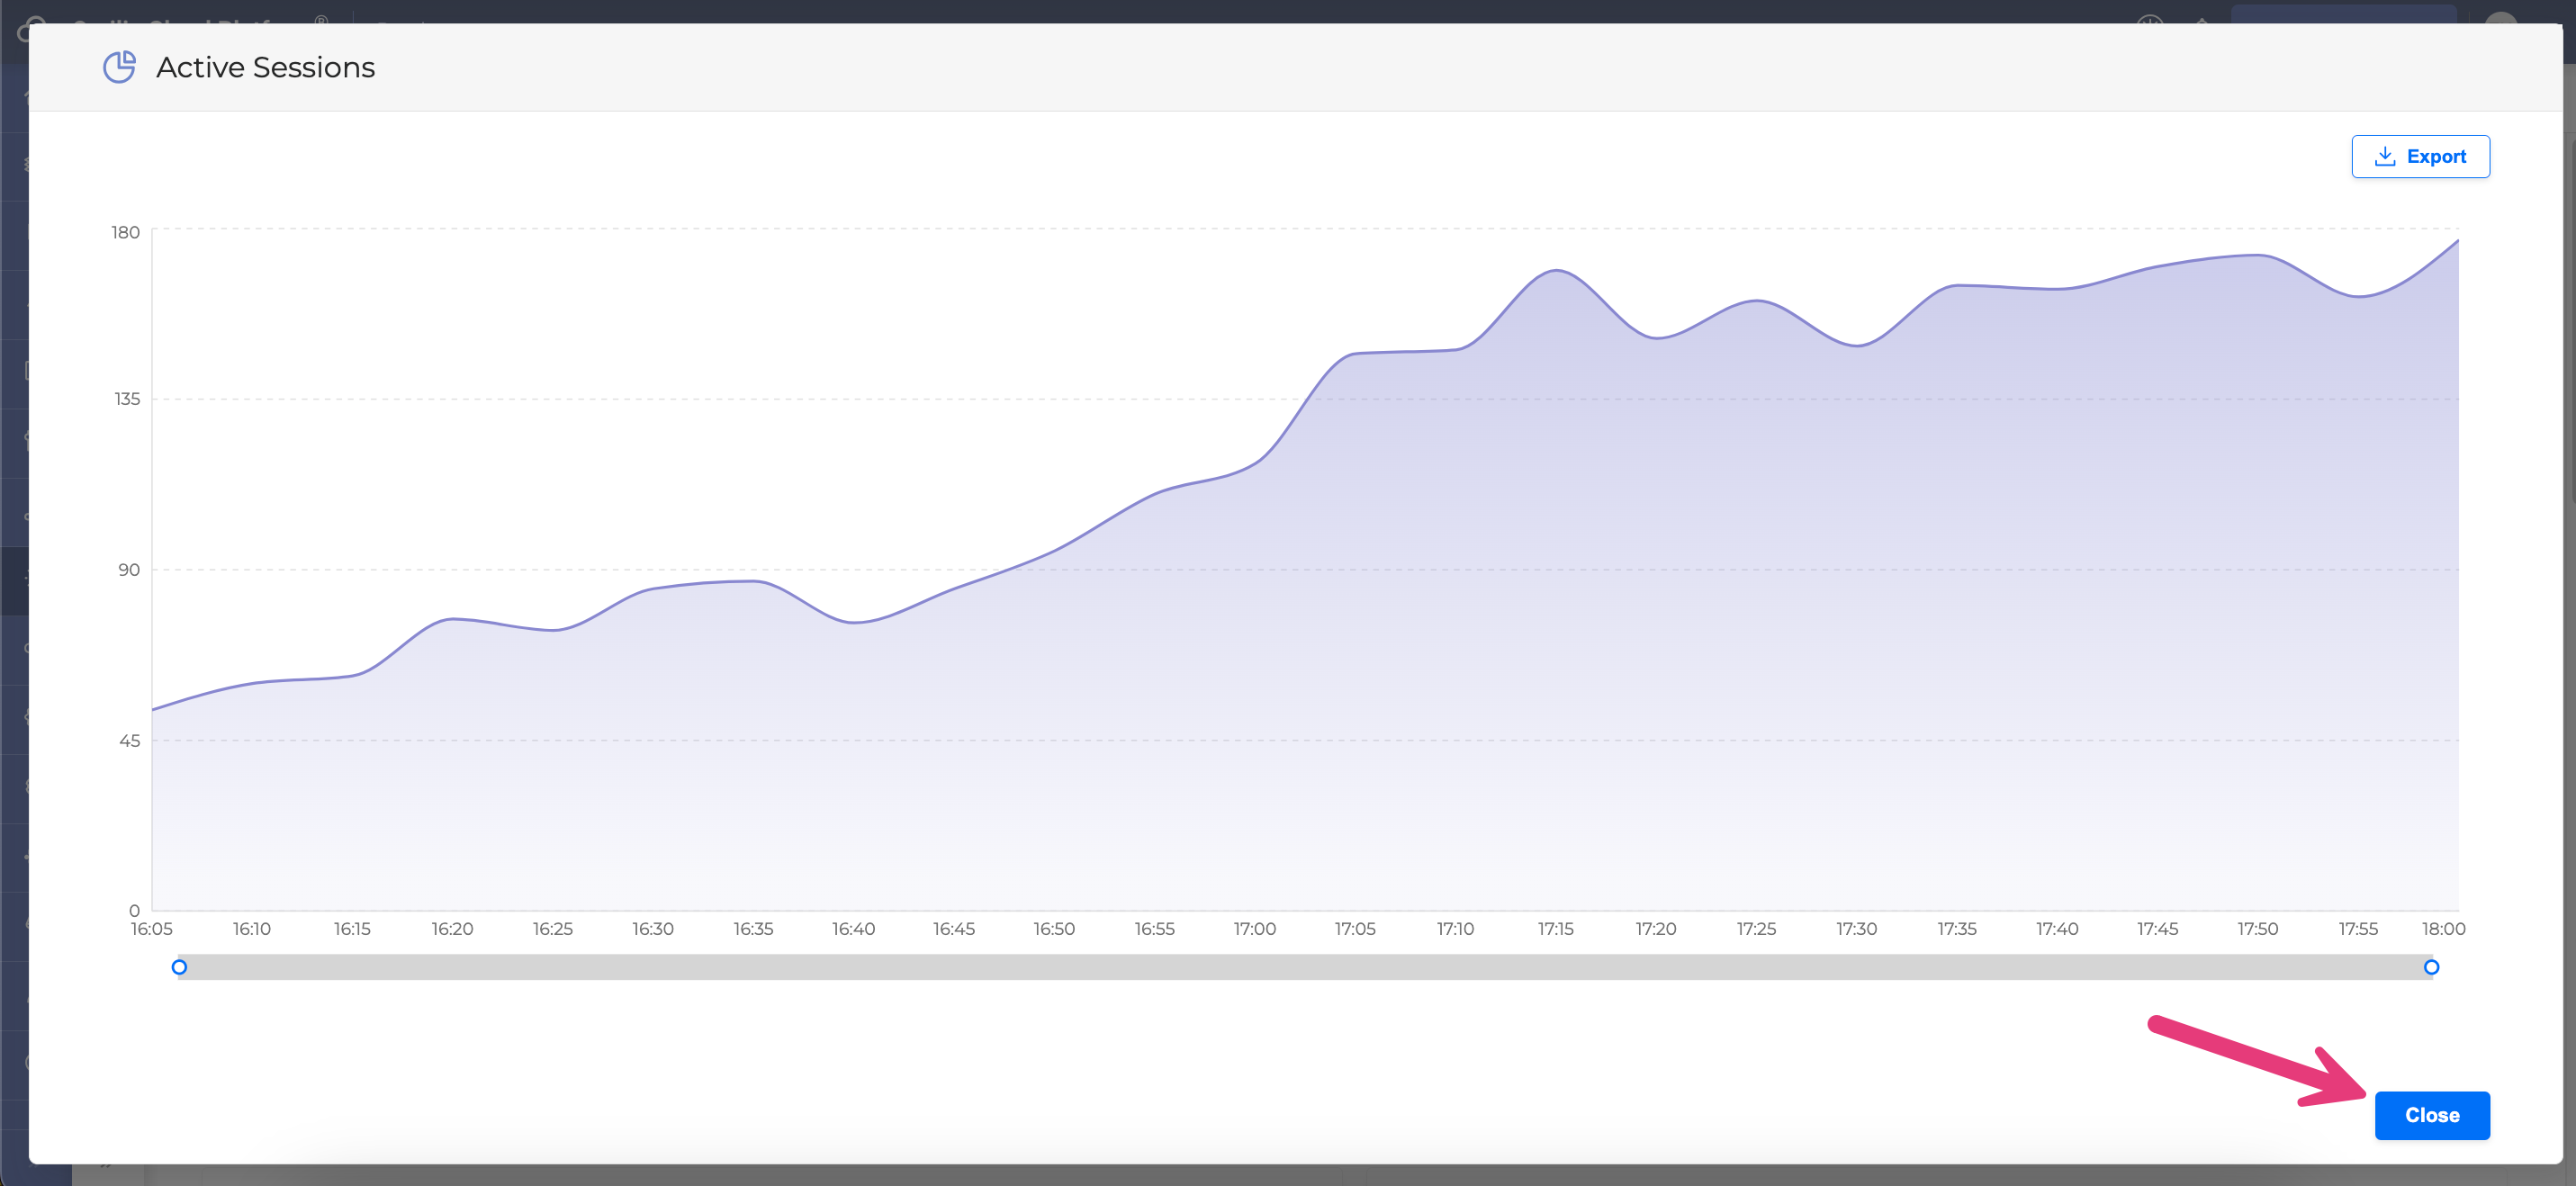
You can close the Full Screen mode by clicking the Close button in the right bottom corner or the grey area outside the modal window.
Downloading data
You can download each report locally as a CSV file by clicking the Export Data button next to each graph.
When in the Full Screen mode, you can also download the report by clicking the Export button. If you change the time range using the slider element and then click the Export button, you can download data for the custom time period you selected.
Selecting metrics
You can select / deselect the metrics displayed in a report by interacting with checkboxes under each graph.
-
Hover over a specific checkbox to view data related to its content only. Once you hover away from the checkbox, the report will display all metrics again.
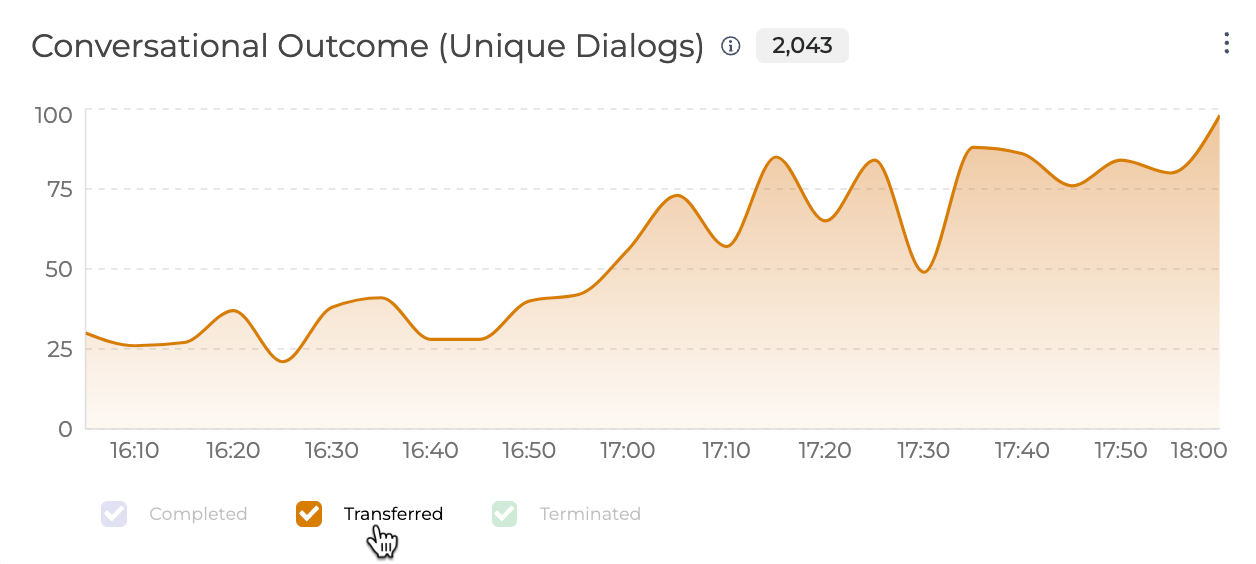
-
Click on the checkbox to make only this metric selected and displayed. You can click multiple checkboxes to display the needed metrics only. Deselecting all checkboxes returns the graph to the initial state where all the metrics are displayed.
Viewing metrics details
You can access the metrics details both from the Real-time report view and Full Screen view of the graph.
Not all graphs contain metric details (for example, the Terminated VS Transferred to Agent report doesn’t have a detailed view).
To view the metrics details, proceed as follows:
-
Hover over the graph to see the metric’s time.
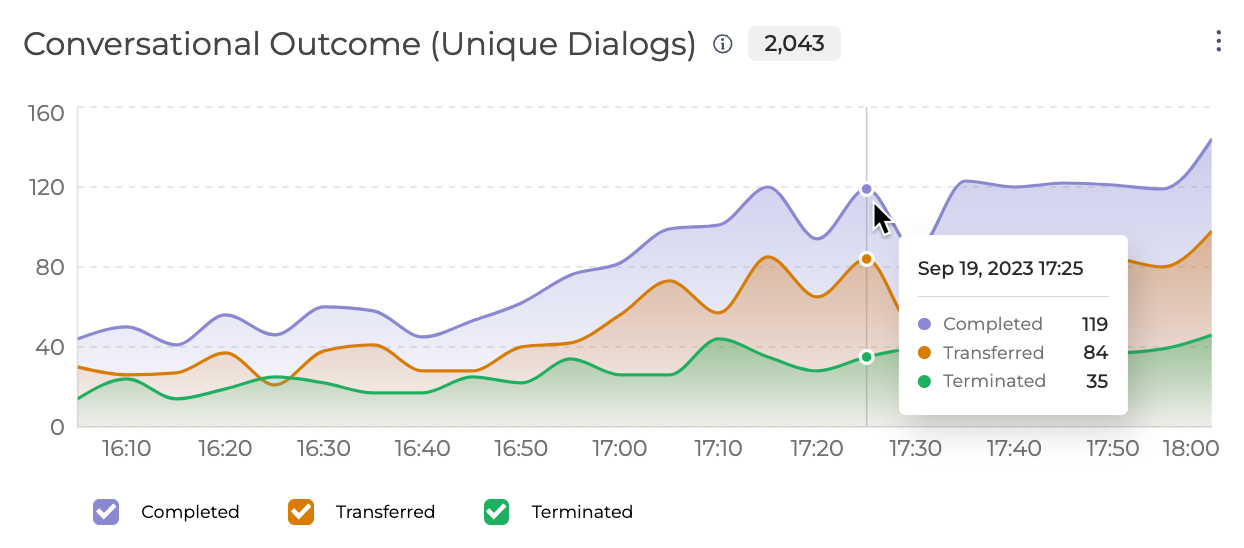
2. Click on a dot with a specific time.
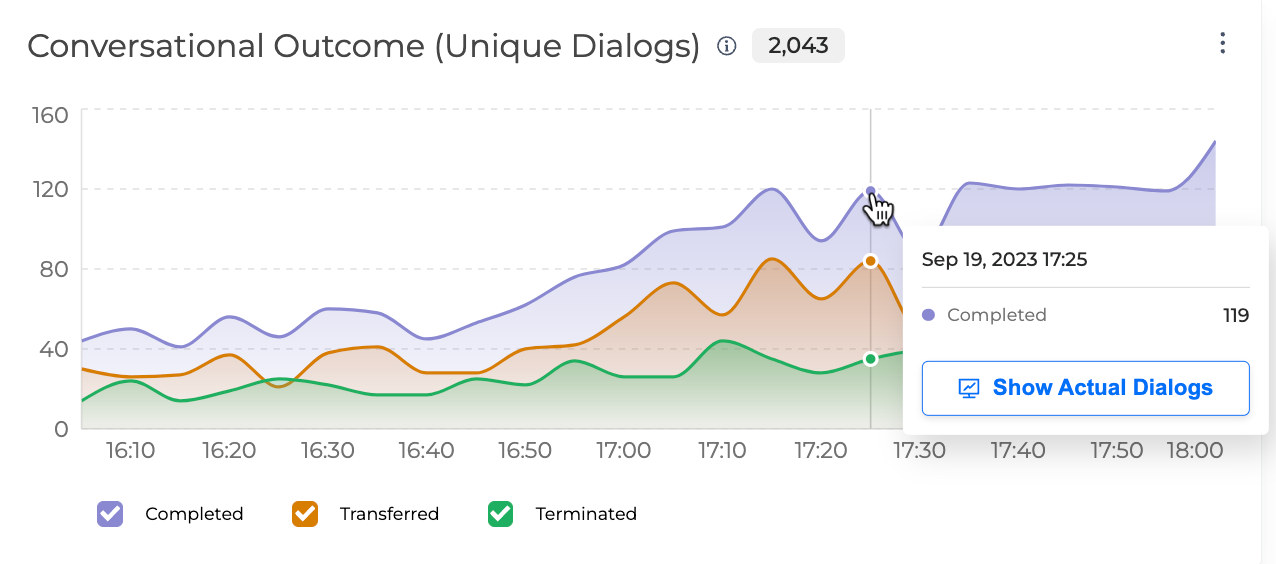
3. Click the Show Actual Dialogs button. You will be redirected to OCP® Monitor to review the dialog IDs corresponding to the reported metric.
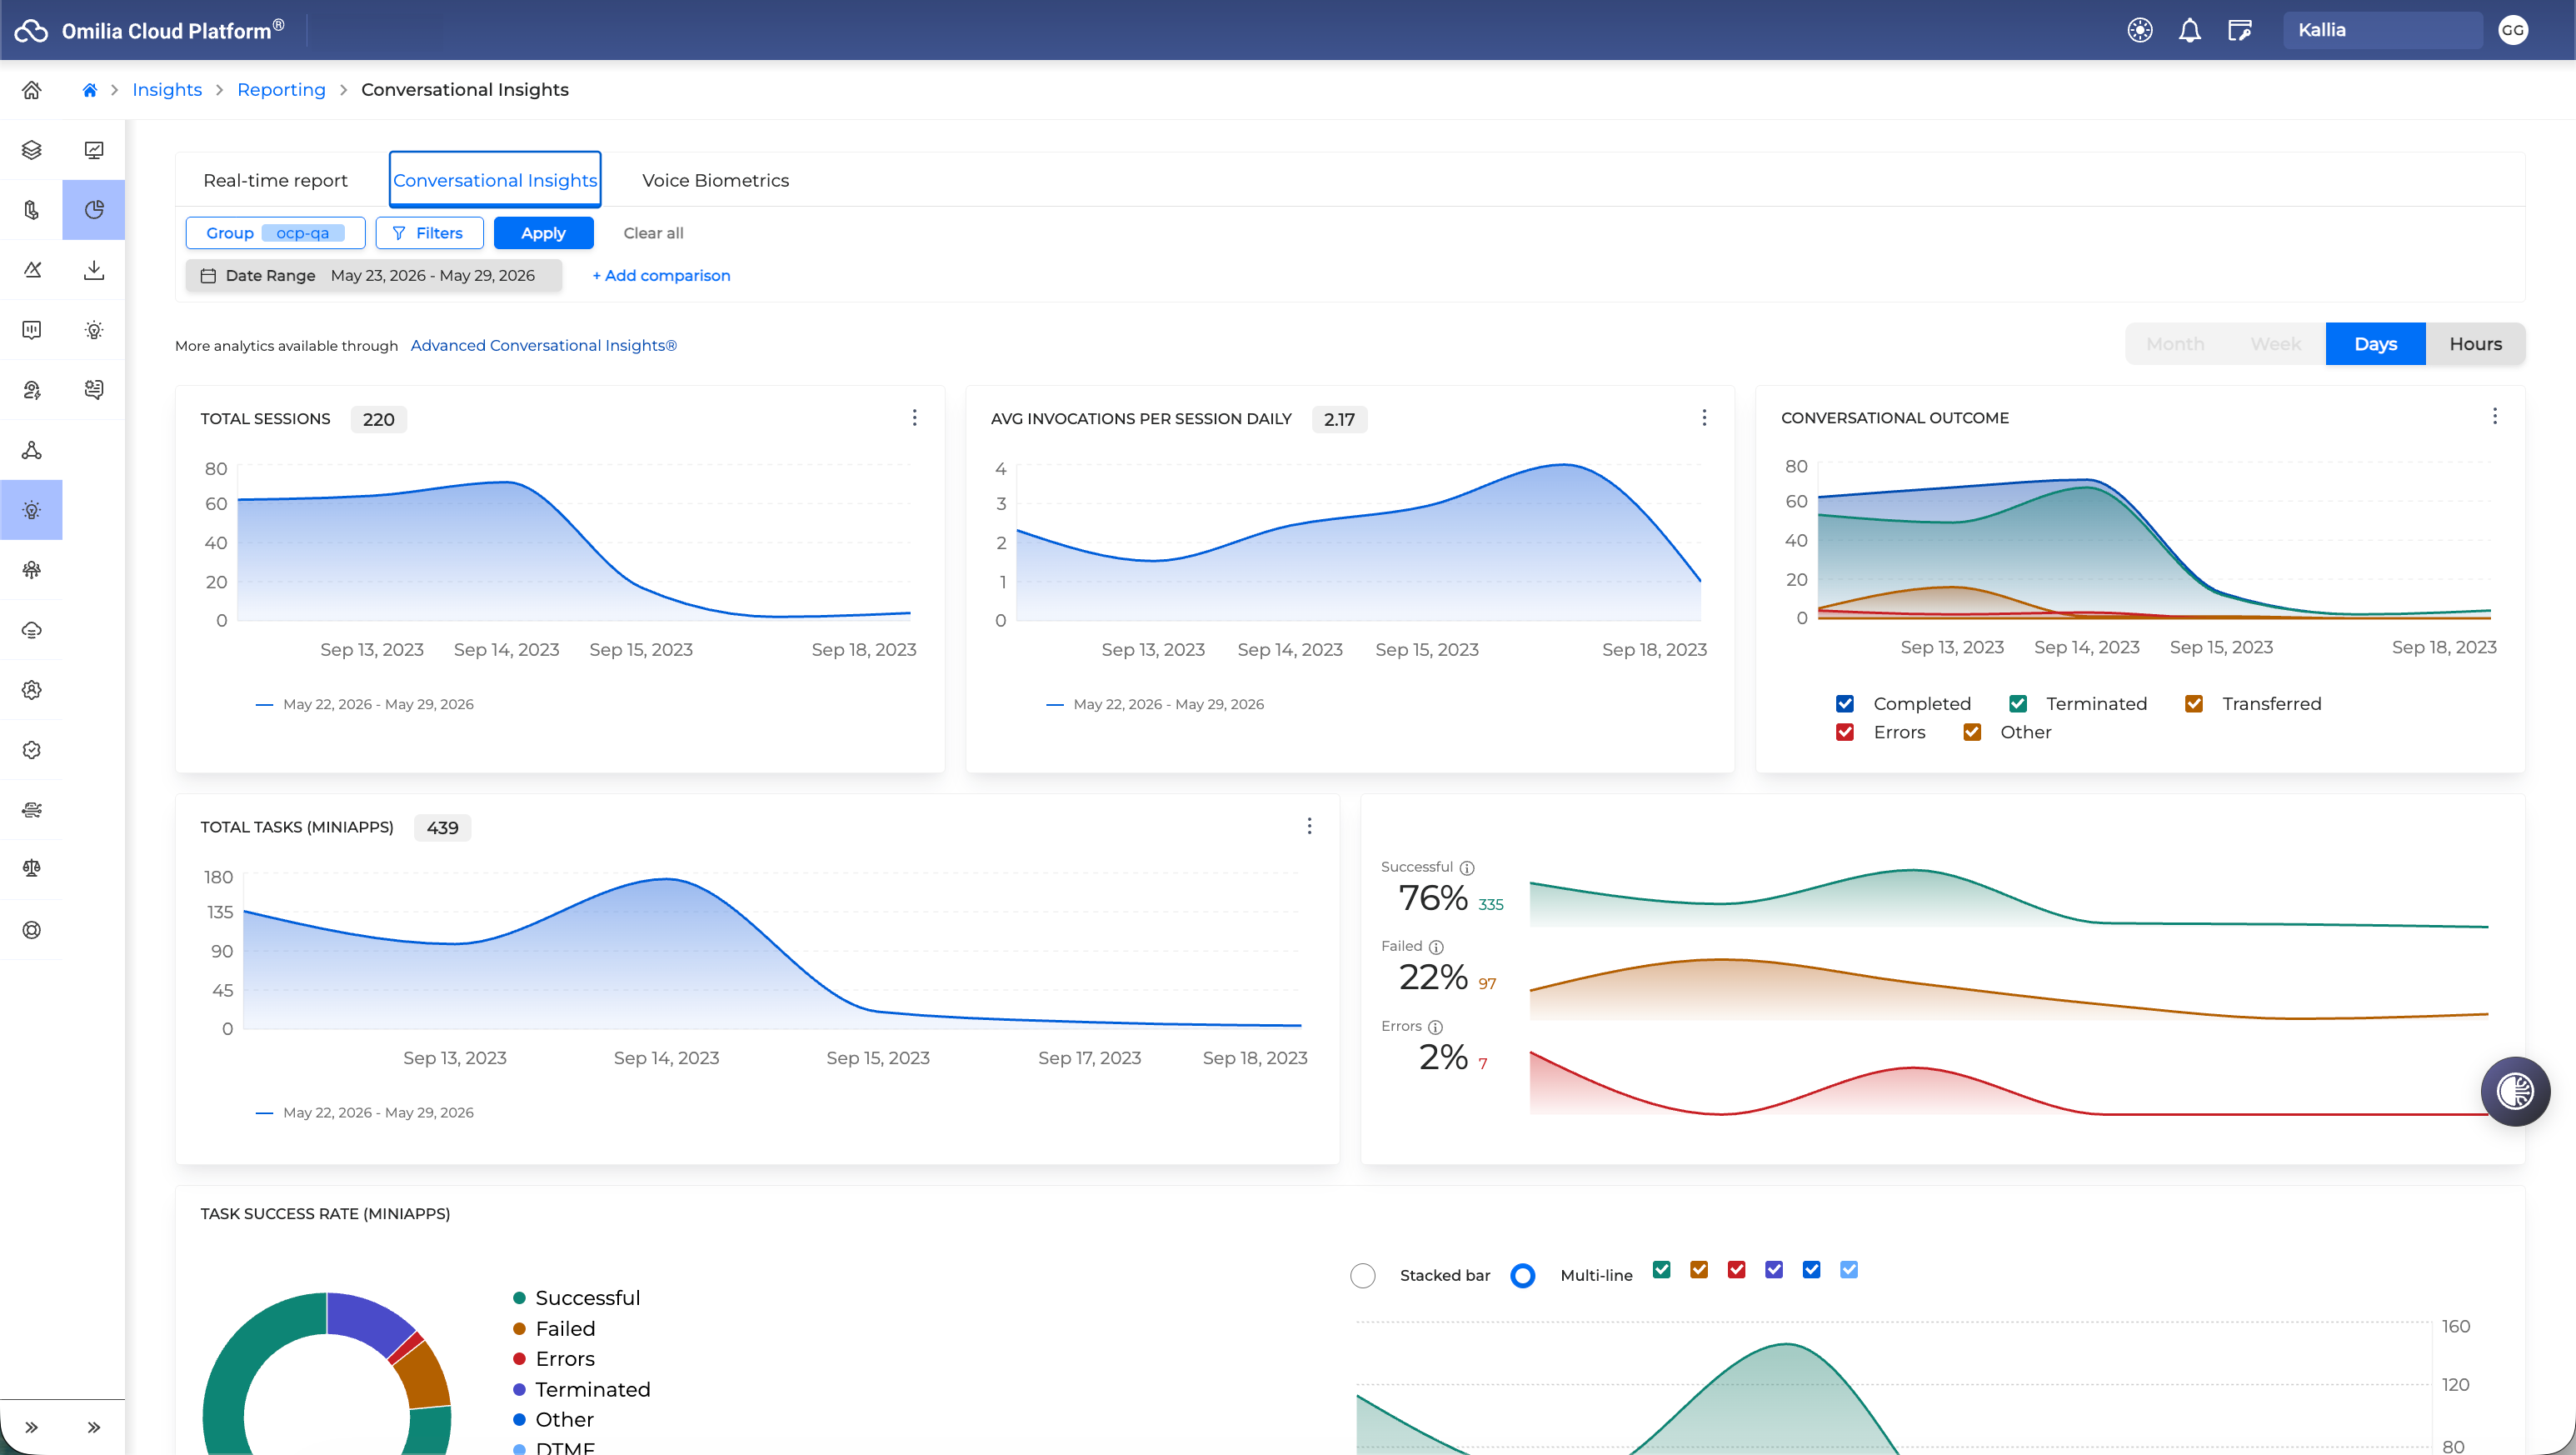
Conversational Insights
OCP Conversational Insights® provides rich, graphical dashboards with key performance metrics and come directly from the system without any analysis from a human.
There are several dashboards to help you identify how your applications are performing and point out possible improvements:
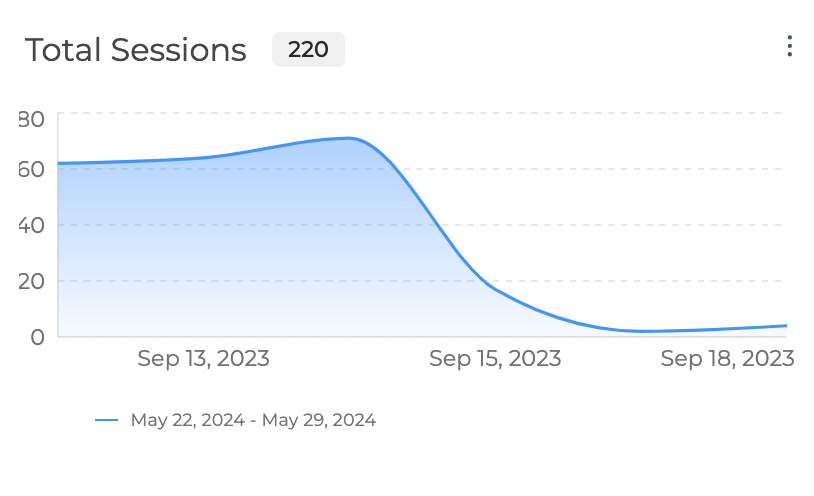
Total Sessions
The Total Sessions interactive visualization shows the number of sessions that a customer is receiving for the selected period. Sessions refer to unique calls or chat sessions, regardless of how many applications were triggered in between.
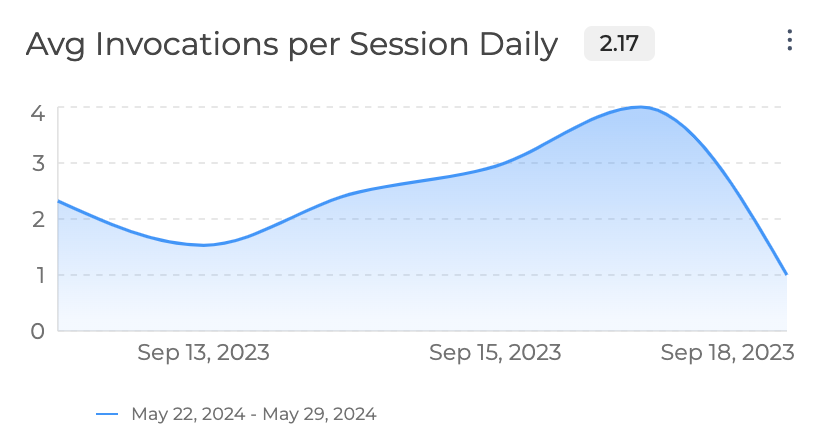
Avg Invocations per Session Daily
The Avg Invocations per Session Daily graph connects sessions to miniApp invocations. Presents how many miniApps are triggered during an average call or chat session.
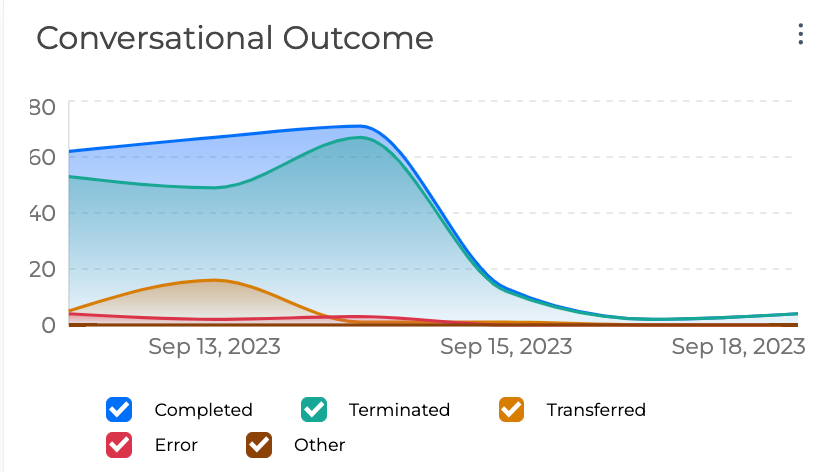
Conversational Outcome
The Conversational Outcome dashboard allows observing number of total dialogs per day.
The data is presented both in numbers and percentages.
-
Completed - how many dialogs have been completed by the user or system. Includes both terminated and transferred dialogs, as well as edge cases, when the dialog end is unknown.
-
Terminated - how many dialogs have been terminated by the user or system.
-
Transferred - how many dialogs have been transferred out of the system, usually to a live agent.
-
Error - how many dialogs have been completed with an error.
-
Other - dialogs which are not classified in any of the above cases. These are not necessary errors, but account for possible edge cases of dialogs for which there wasn’t enough information received to determine the exact termination type.
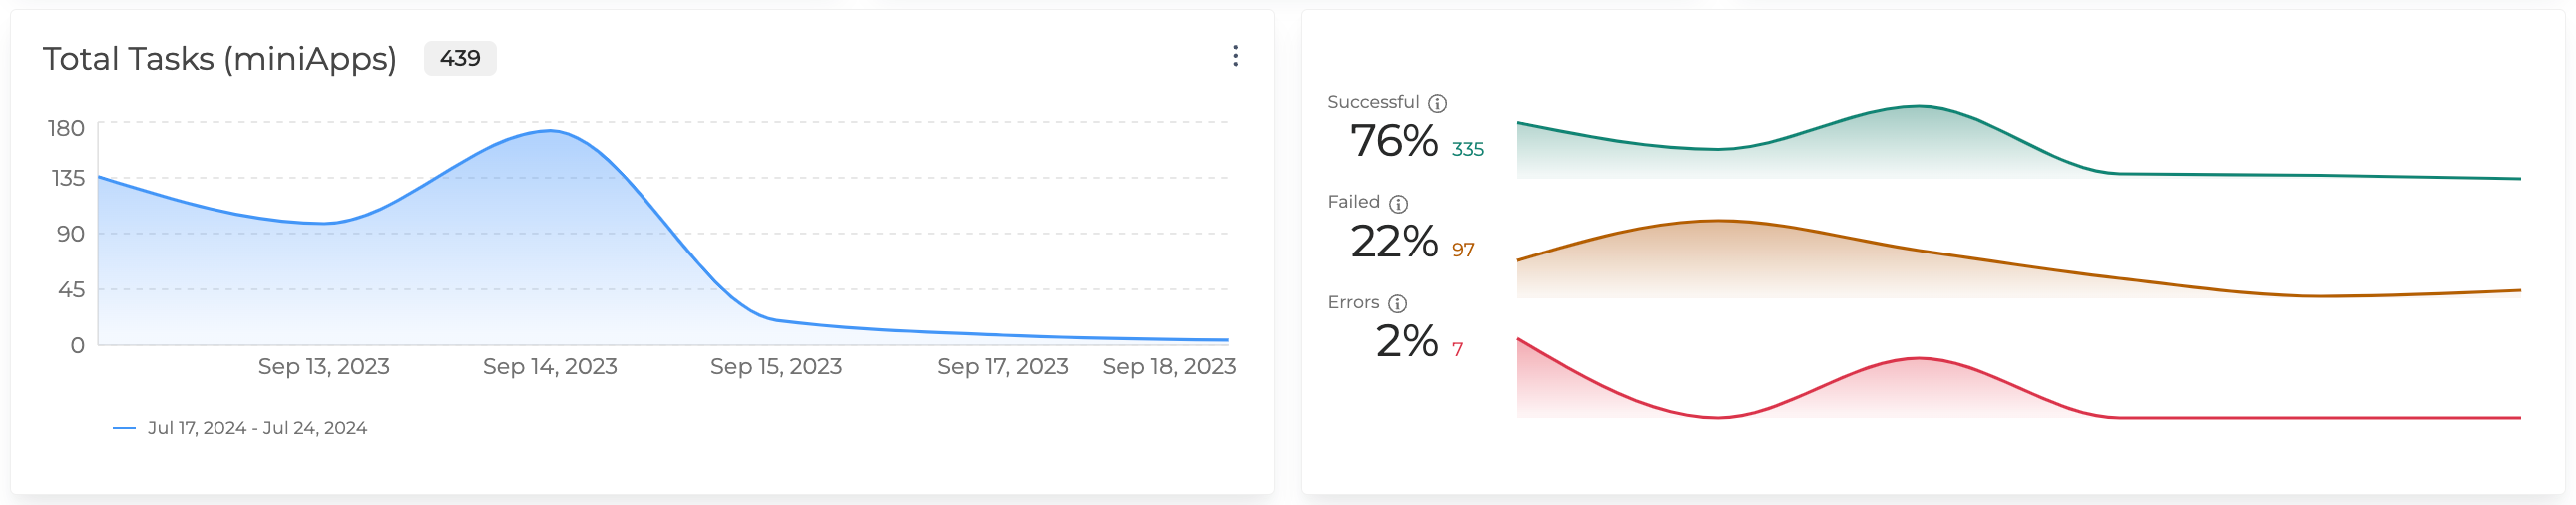
Total Tasks (miniApps)
A graphical representation of the total invocations during the selected period of time, as well as the percentage of the successful against the unsuccessful ones due to fail or error.
Task Success Rate (miniApps)
A graphical representation of the the miniApp results of all the invocations within the selected period. The Multi-line graph is customizable and is possible to select to view only the desired results. Click on the checkboxes to remove or add back a task category.
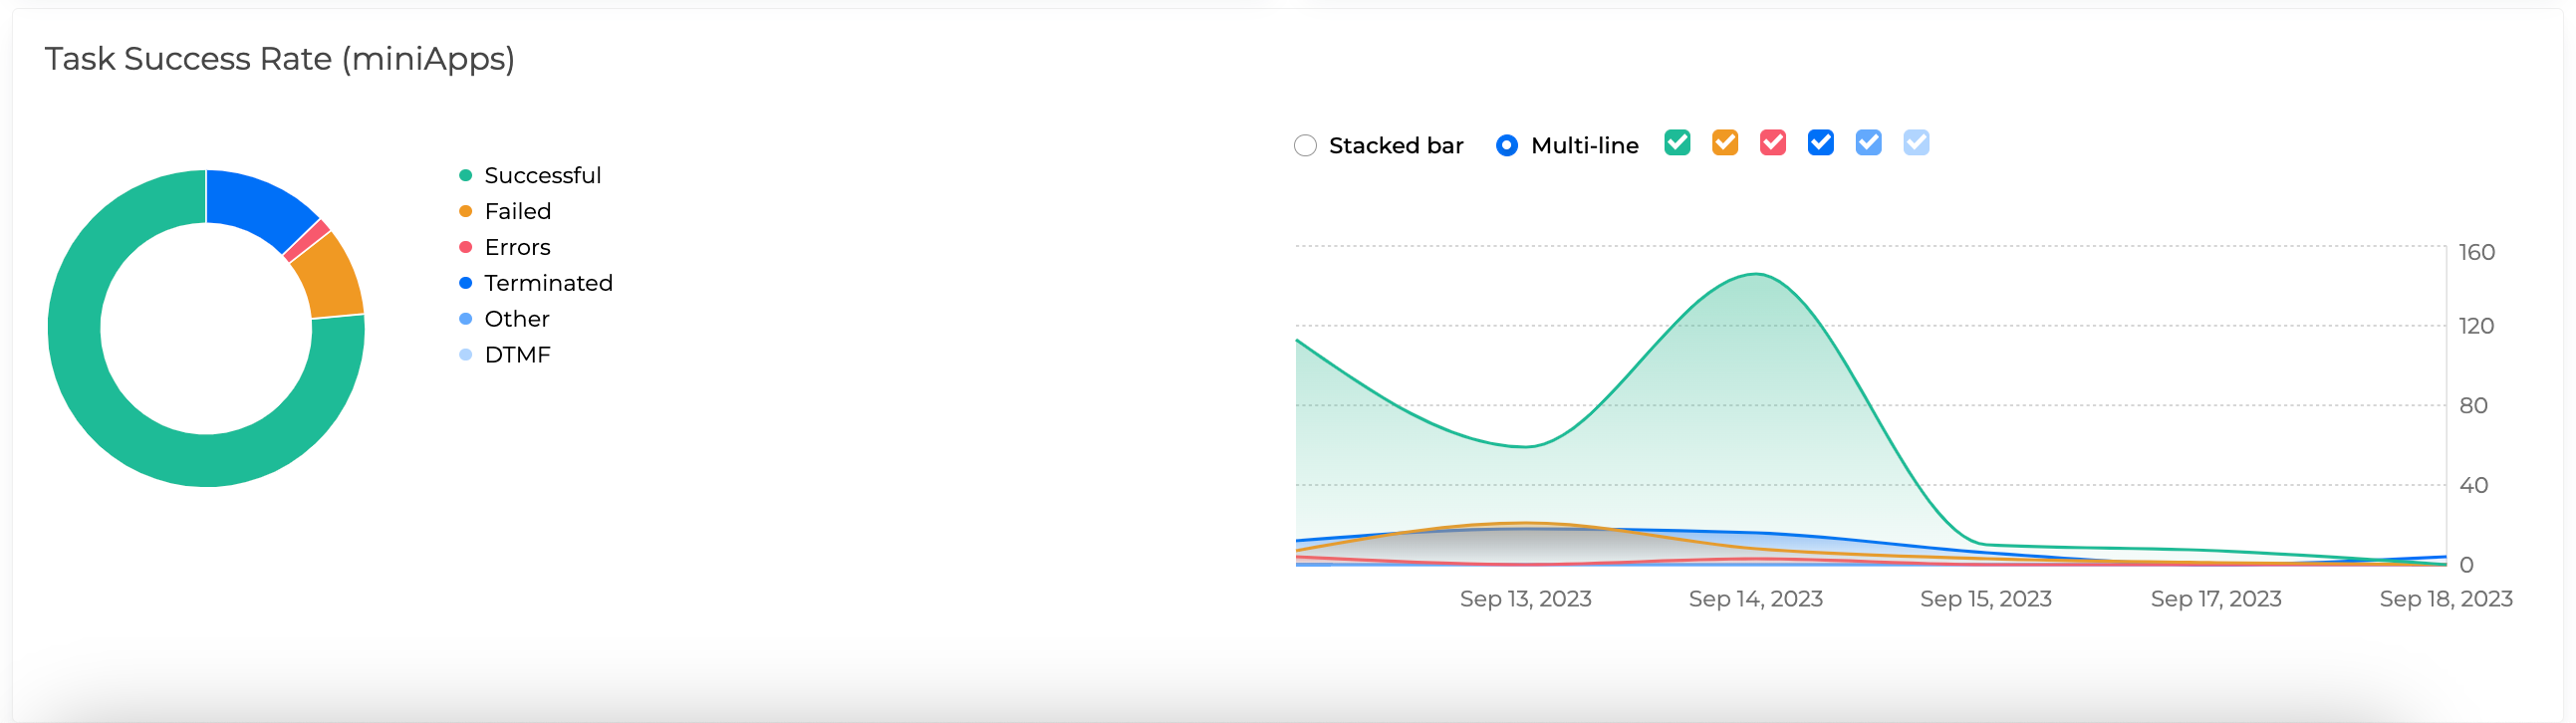
The Task Success Rate (miniApps) graph shows the success and failure rates of the selected miniApps. This is the task completion rate of each miniApp, which breaks down in the Overall miniApp Success Rate graph to:
-
Successful Invocations - the percentage of successful invocations over the total number of invocations on a daily basis.
-
Failed Invocations - the percentage of failed invocations over the total number of invocations on a daily basis.
-
Terminated - the percentage of terminated by the user invocations over the total number of invocations on a daily basis.
-
DTMF Escape Key - the total number of invocations within which the user opted out using the DTMF escape key over the total number of invocations on a daily basis.
-
Errors - the total number of invocations with at least one system error over the total number of invocations on a per-day basis.
-
Other - a final categorization that captures all invocations not falling in the above categories. These may include yet unclassified errors or edge cases.
Task Agents Reporting
Task Agents Reporting surfaces performance and outcome data for Agentic AI tasks executed within your dialog flows. Each time a task agent runs inside a conversation, its outcome is recorded and aggregated, following the same reporting logic already used for Self-Service and miniApps metrics.
The report answers a simple operational question: how many task agents ran, and how many of them succeeded versus failed.
You can find the Task Agents reports in the Conversational Insights tab, alongside the existing dashboards.
Total Tasks (Task Agents)
The Total Tasks (Task Agents) report shows the total number of task agent invocations over the selected period, broken down by outcome. Each counter increases after a task agent completes within a dialog.
The following metrics are available:
-
Total: The total number of task agent invocations, regardless of outcome.
-
Completed: The number of task agent invocations that completed successfully.
-
Failed: The number of task agent invocations that ended in failure.
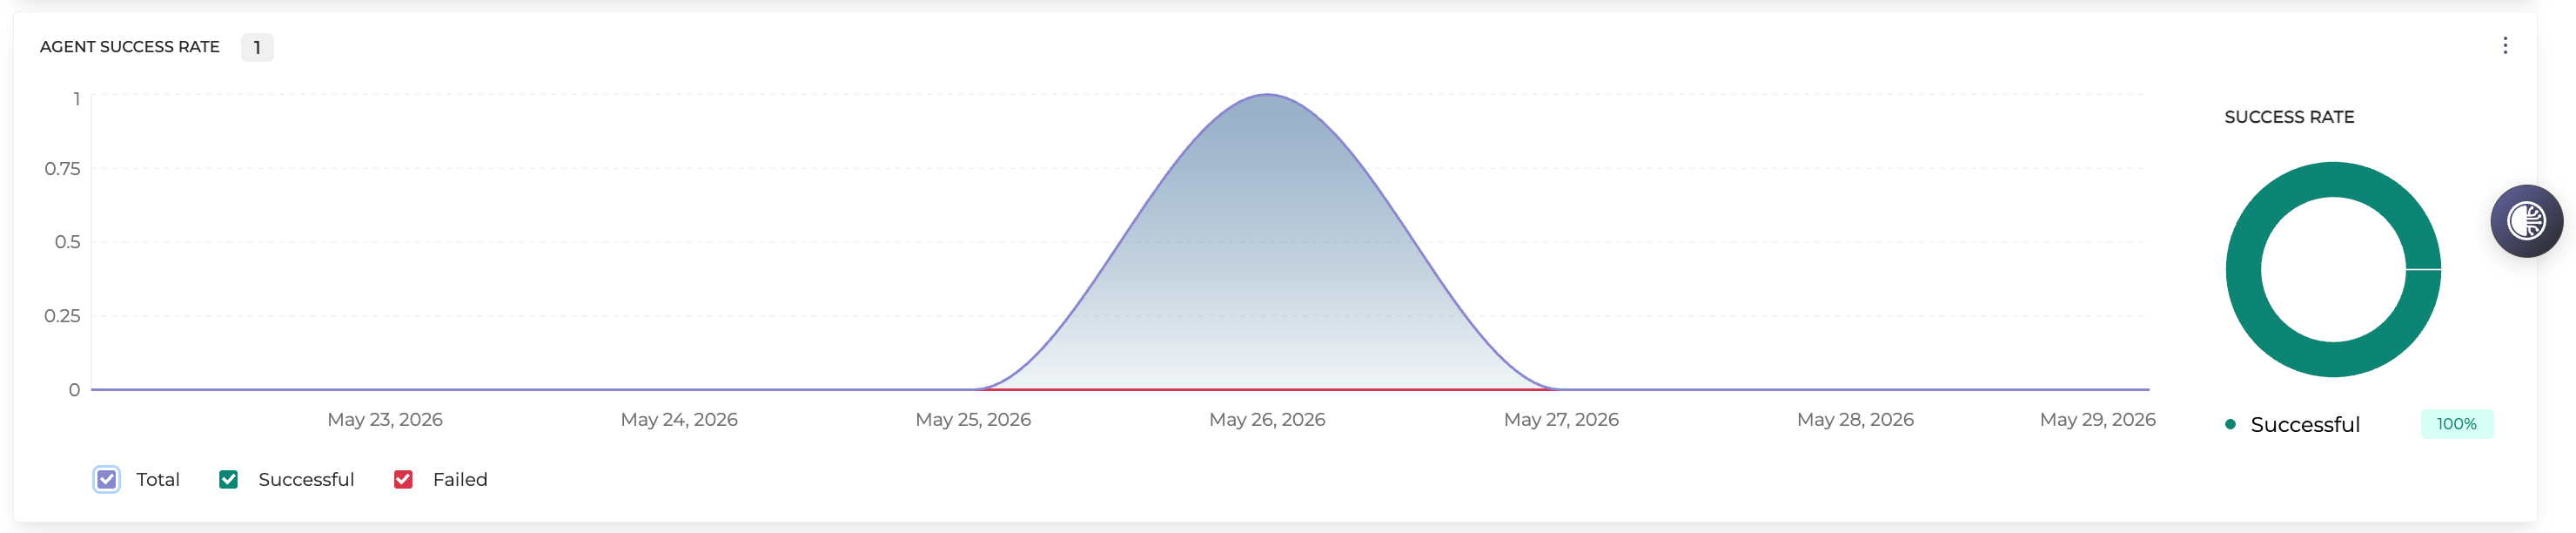
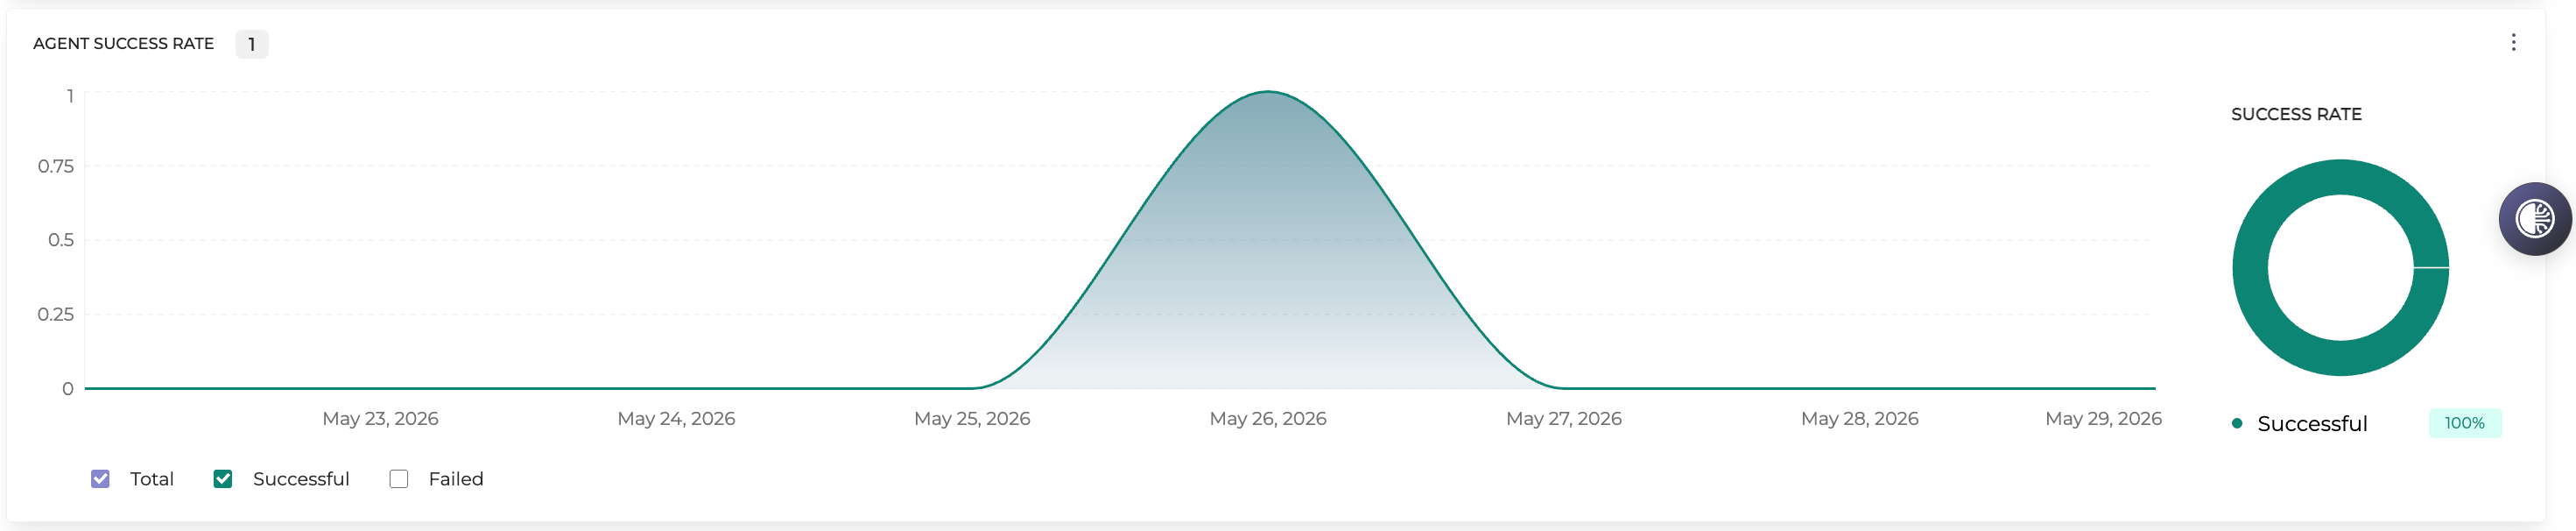
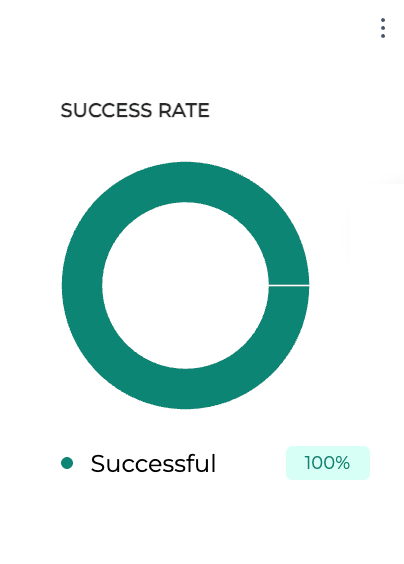
Task Agent Success Rate
The Task Agent Success Rate report displays the proportion of successful task agent invocations (completed) over the total number of invocations for the selected period. It mirrors the Task Success Rate (miniApps) report and is presented both in numbers and percentages.
-
Completed: The percentage of task agents that completed successfully over the total number of invocations.
-
Failed: The percentage of task agents that failed over the total number of invocations.
Filtering by Agentic App Name
A new Agentic App Name filter lets you narrow the Task Agents reports to a specific agentic application. The filter presents a dropdown of the available agentic applications, so you can isolate the performance of a single task agent rather than viewing all of them together.
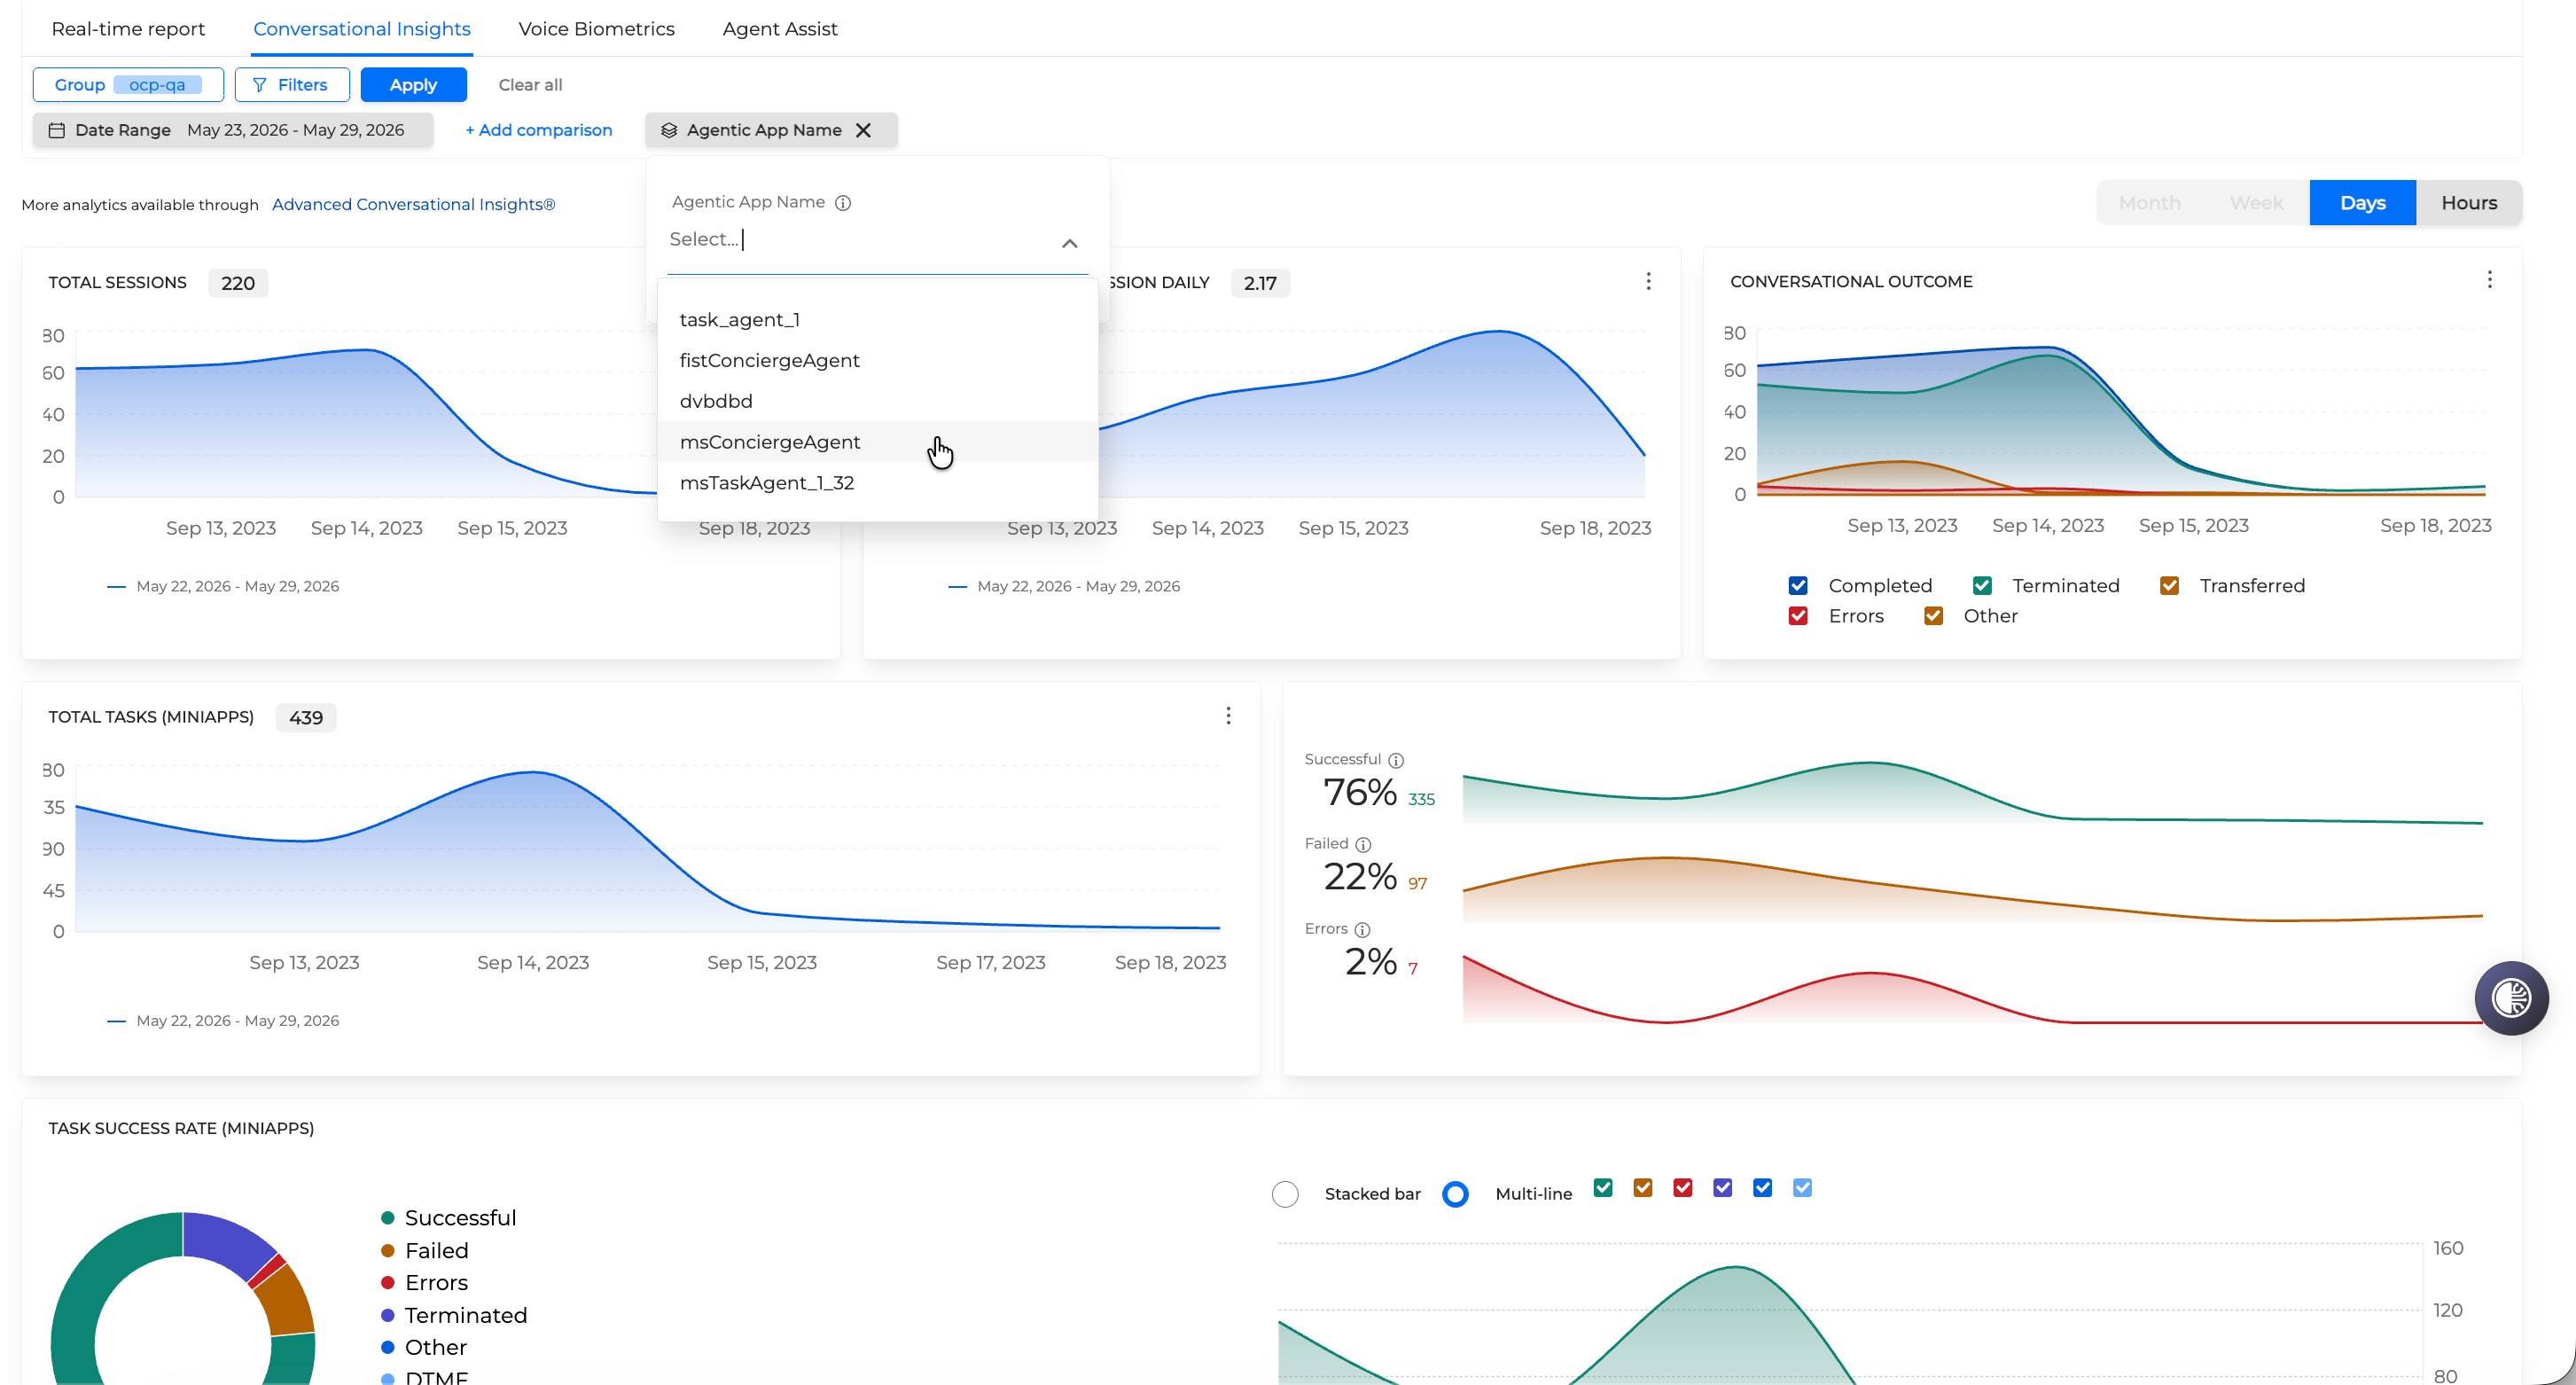
To filter the Task Agents reports:
-
Click the Filters button.
-
Select the desired agentic application from the Agentic App Name dropdown, together with any other filters you need (Date range, Group, Channel, Language).
-
Click the View button to update the results.
-
Click Clear All to reset the filters.
Searching agentic applications in Monitor
The same Agentic App Name field is also available in OCP® Monitor, where a dedicated agentic search section lets you locate dialogs by agentic application. Select the agentic application from the Agentic App Name dropdown to retrieve the relevant dialogs for review. For more details on searching dialogs, see OCP® Monitor.
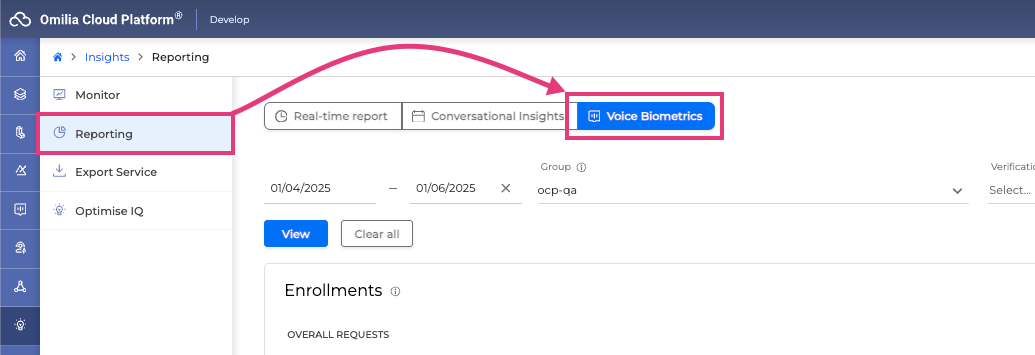
Voice Biometrics Reporting
Reporting in Voice Biometrics (VB) enables users to gather information on enrollments and verifications, including an Overall Enrollment Request graph, enrollment success rate, verification pass rate, and score distribution chart.
To access Voice Biometrics Reporting, navigate to the Voice Biometrics tab in Reporting.
Voice Biometrics Reporting Filters
Use the provided filters to refine your search as needed.
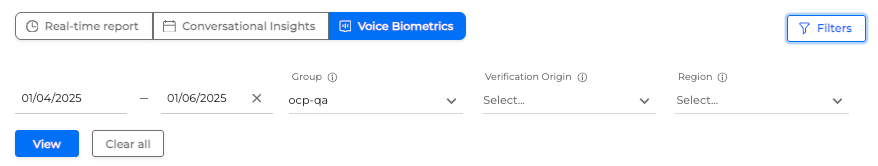
-
Date range: Specify the date range for data extraction.
-
Group: Select the group for data extraction.
-
Verification origin: Choose either Agent (Live Agent) or IVR (Virtual Agent) .
-
Region: Select a region if your environment supports multiple regions.
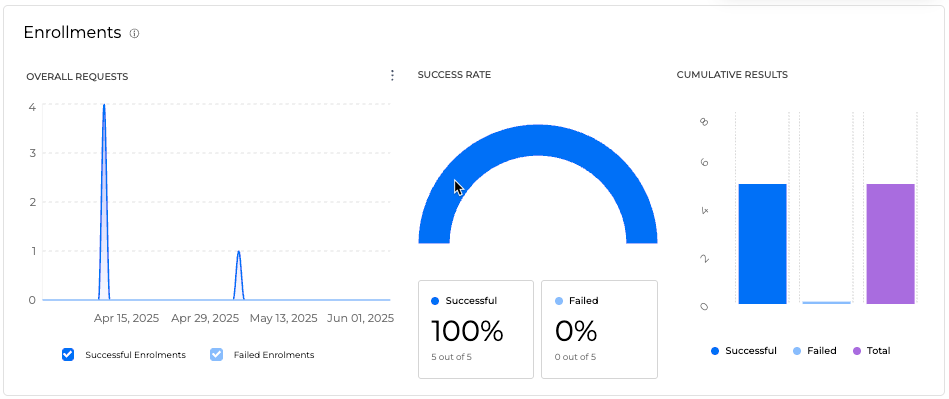
Enrollments report
-
Overall requests: A graph showing successful and failed enrollment requests over the specified period.
-
Success rate: Percentage of successful and failed enrollments.
-
Cumulative results: Sum of successful, failed, and overall enrollments requests, over the selected date range.
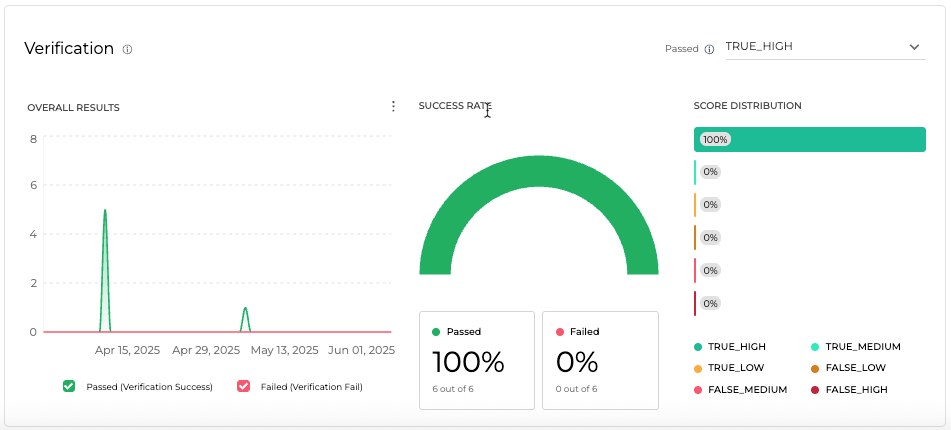
Verifications report
-
Overall requests: A graph displaying the number of passed and failed verifications over the selected date range.
-
Success rate: The percentage of successful and failed enrollments. By default only TRUE HIGH are considered Passed verification, but users may change that to include TRUE_MEDIUM as well.
-
Score distribution: The distribution of different verification results.
Liveness Detection Report
OCP Reporting now includes dedicated visibility into Liveness Detection outcomes at the call level. This helps teams understand how much suspicious voice traffic is reaching their applications, monitor trends over time, and filter results by operational dimensions such as group, region, and call origin.
Liveness Detection is a security capability designed to help determine whether the voice in a call appears to come from a live human speaker or from a spoofing attempt (such as synthetic or replayed audio).
It is intended to help detect multiple categories of spoofing, including:
-
Text-to-speech (TTS) deepfake attacks
-
Replay attacks, where recorded audio is played back
-
Out-of-domain or contextually suspicious utterances used as an additional fraud signal
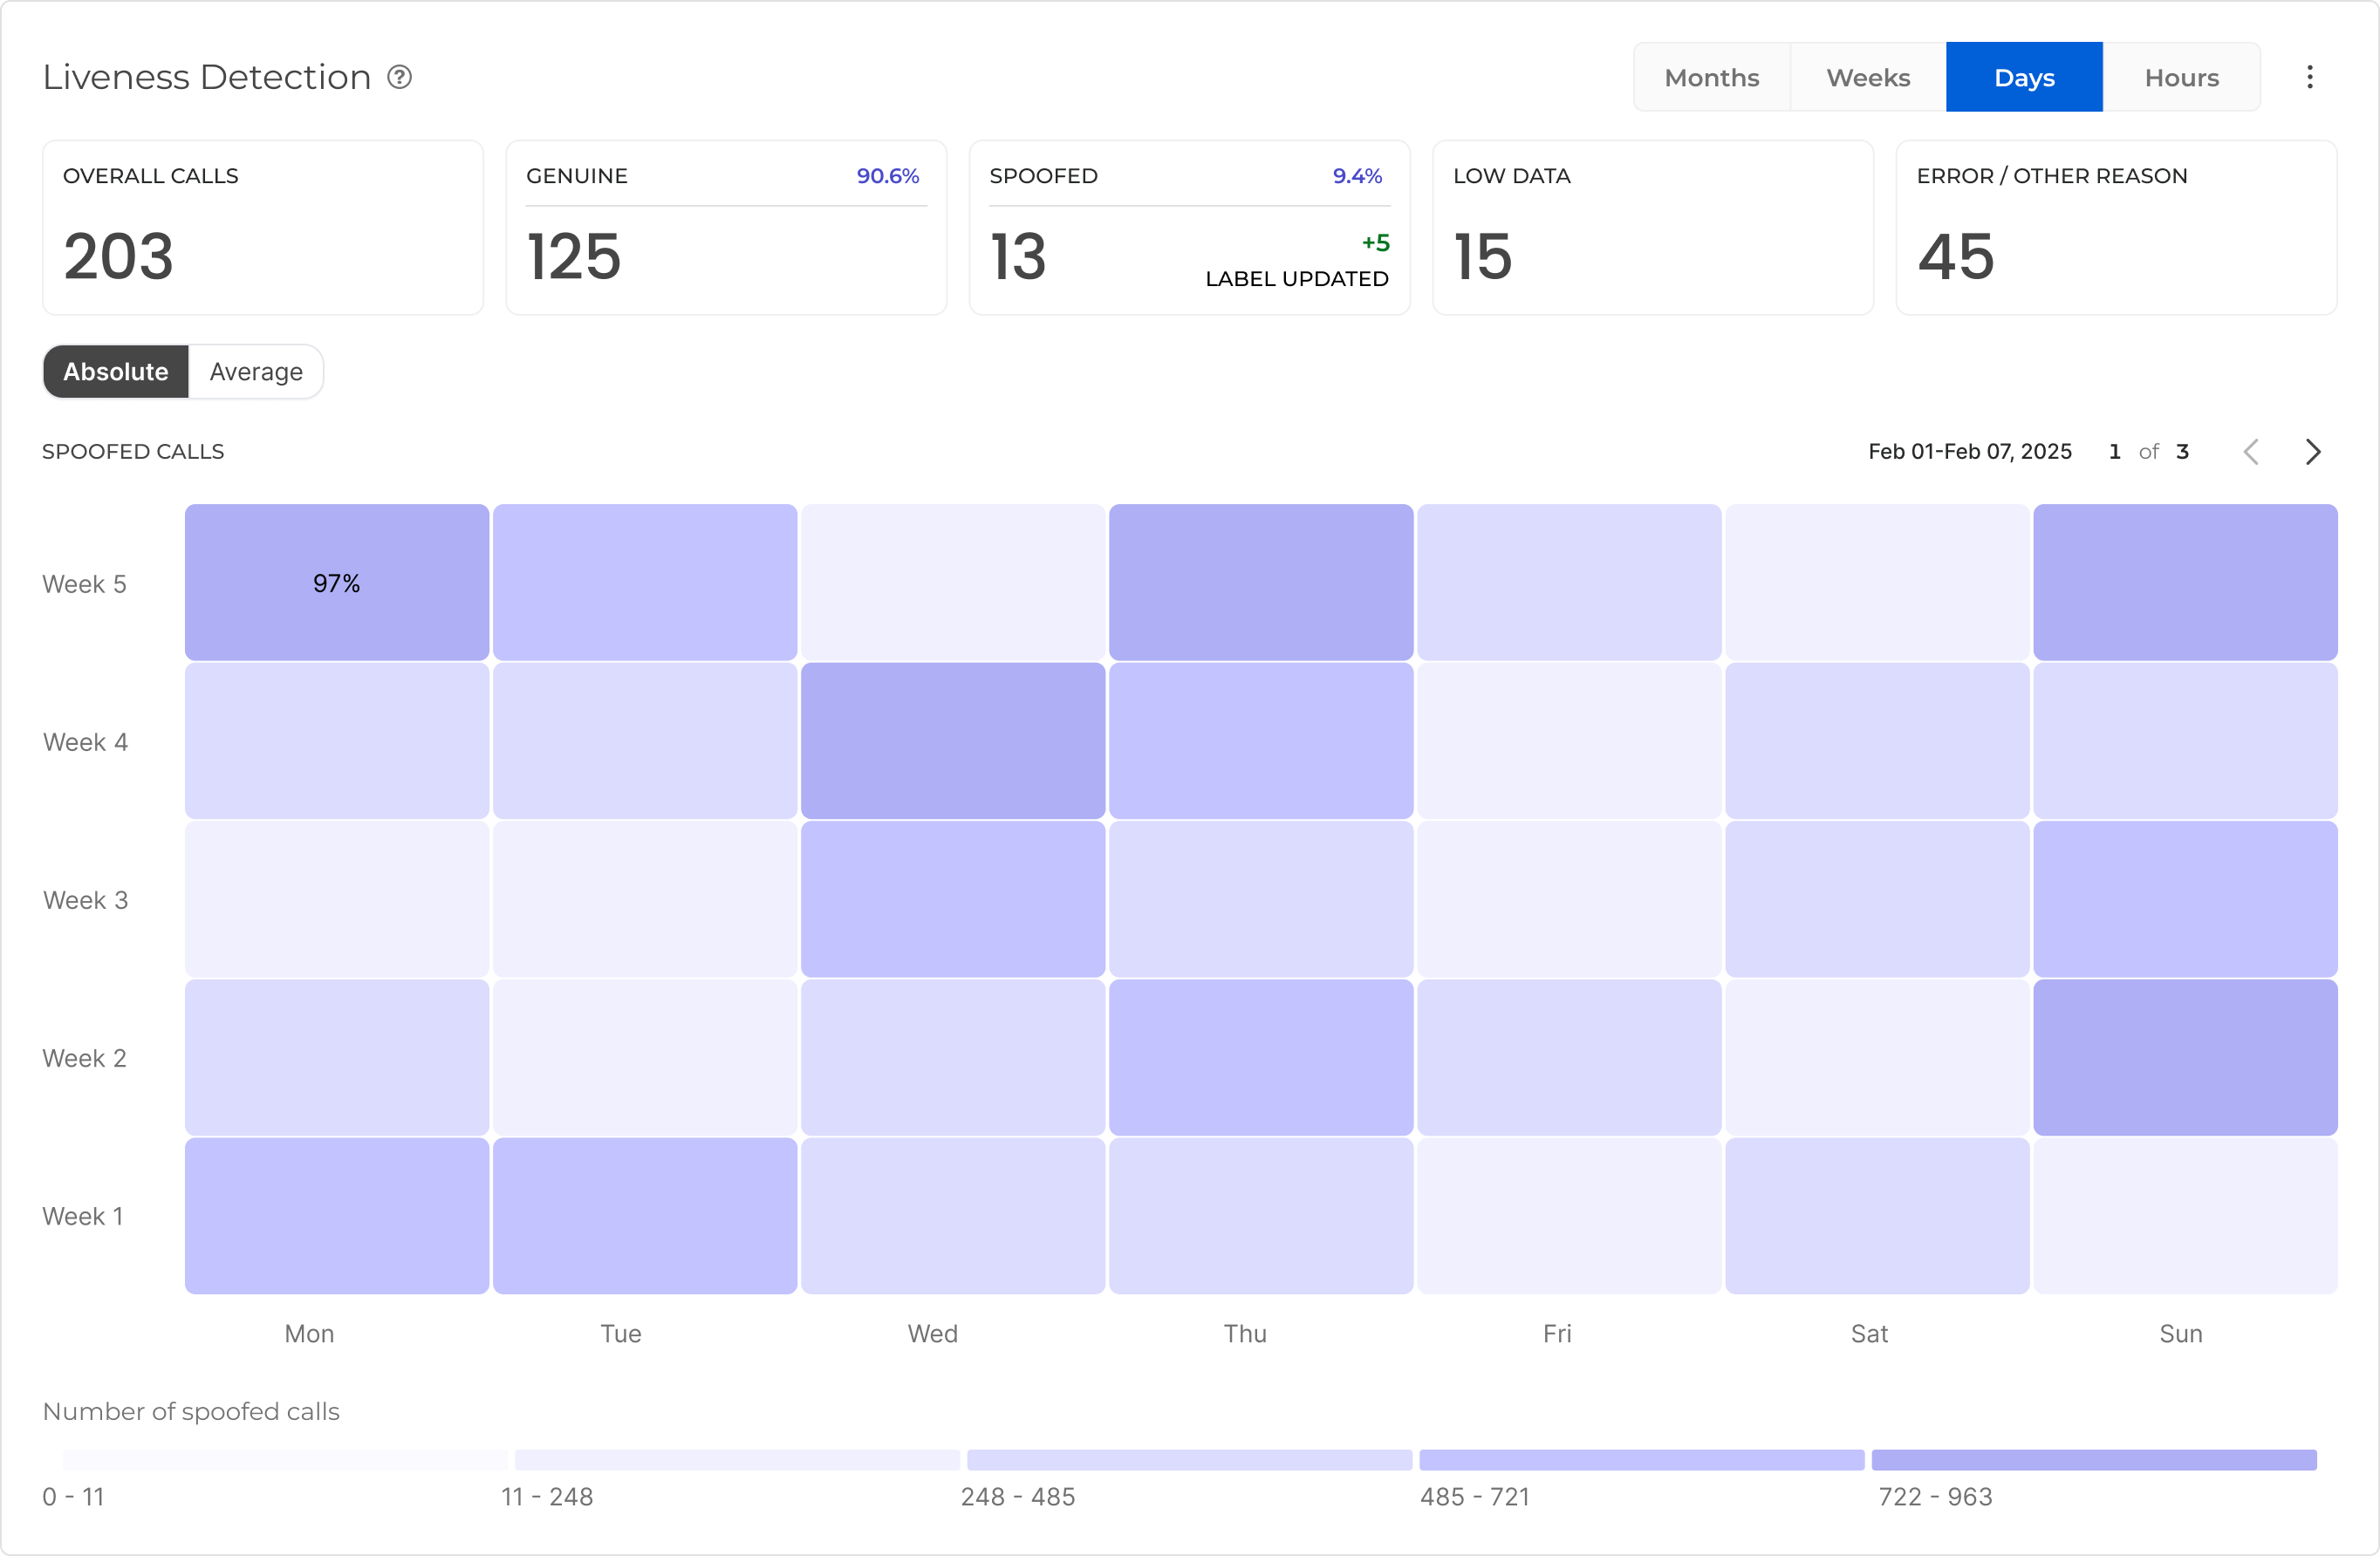
The new reporting is designed to provide clear access to:
-
Call-level liveness outcomes (for example: genuine, spoofed, low-data, and related result categories)
-
Counts and trends showing how many suspicious calls reached an application
-
Filtering/segmentation by supported operational filters (for example group, region, call origin)
-
Historical trend analysis across selected time periods
Best use case
Use Liveness Detection reporting to monitor patterns and trends. For deep investigation of a single interaction, use OCP monitoring tools alongside reporting.
This report improves visibility and analytics only. It does not change how Liveness Detection makes decisions during a call; it makes outcomes easier to review in OCP.
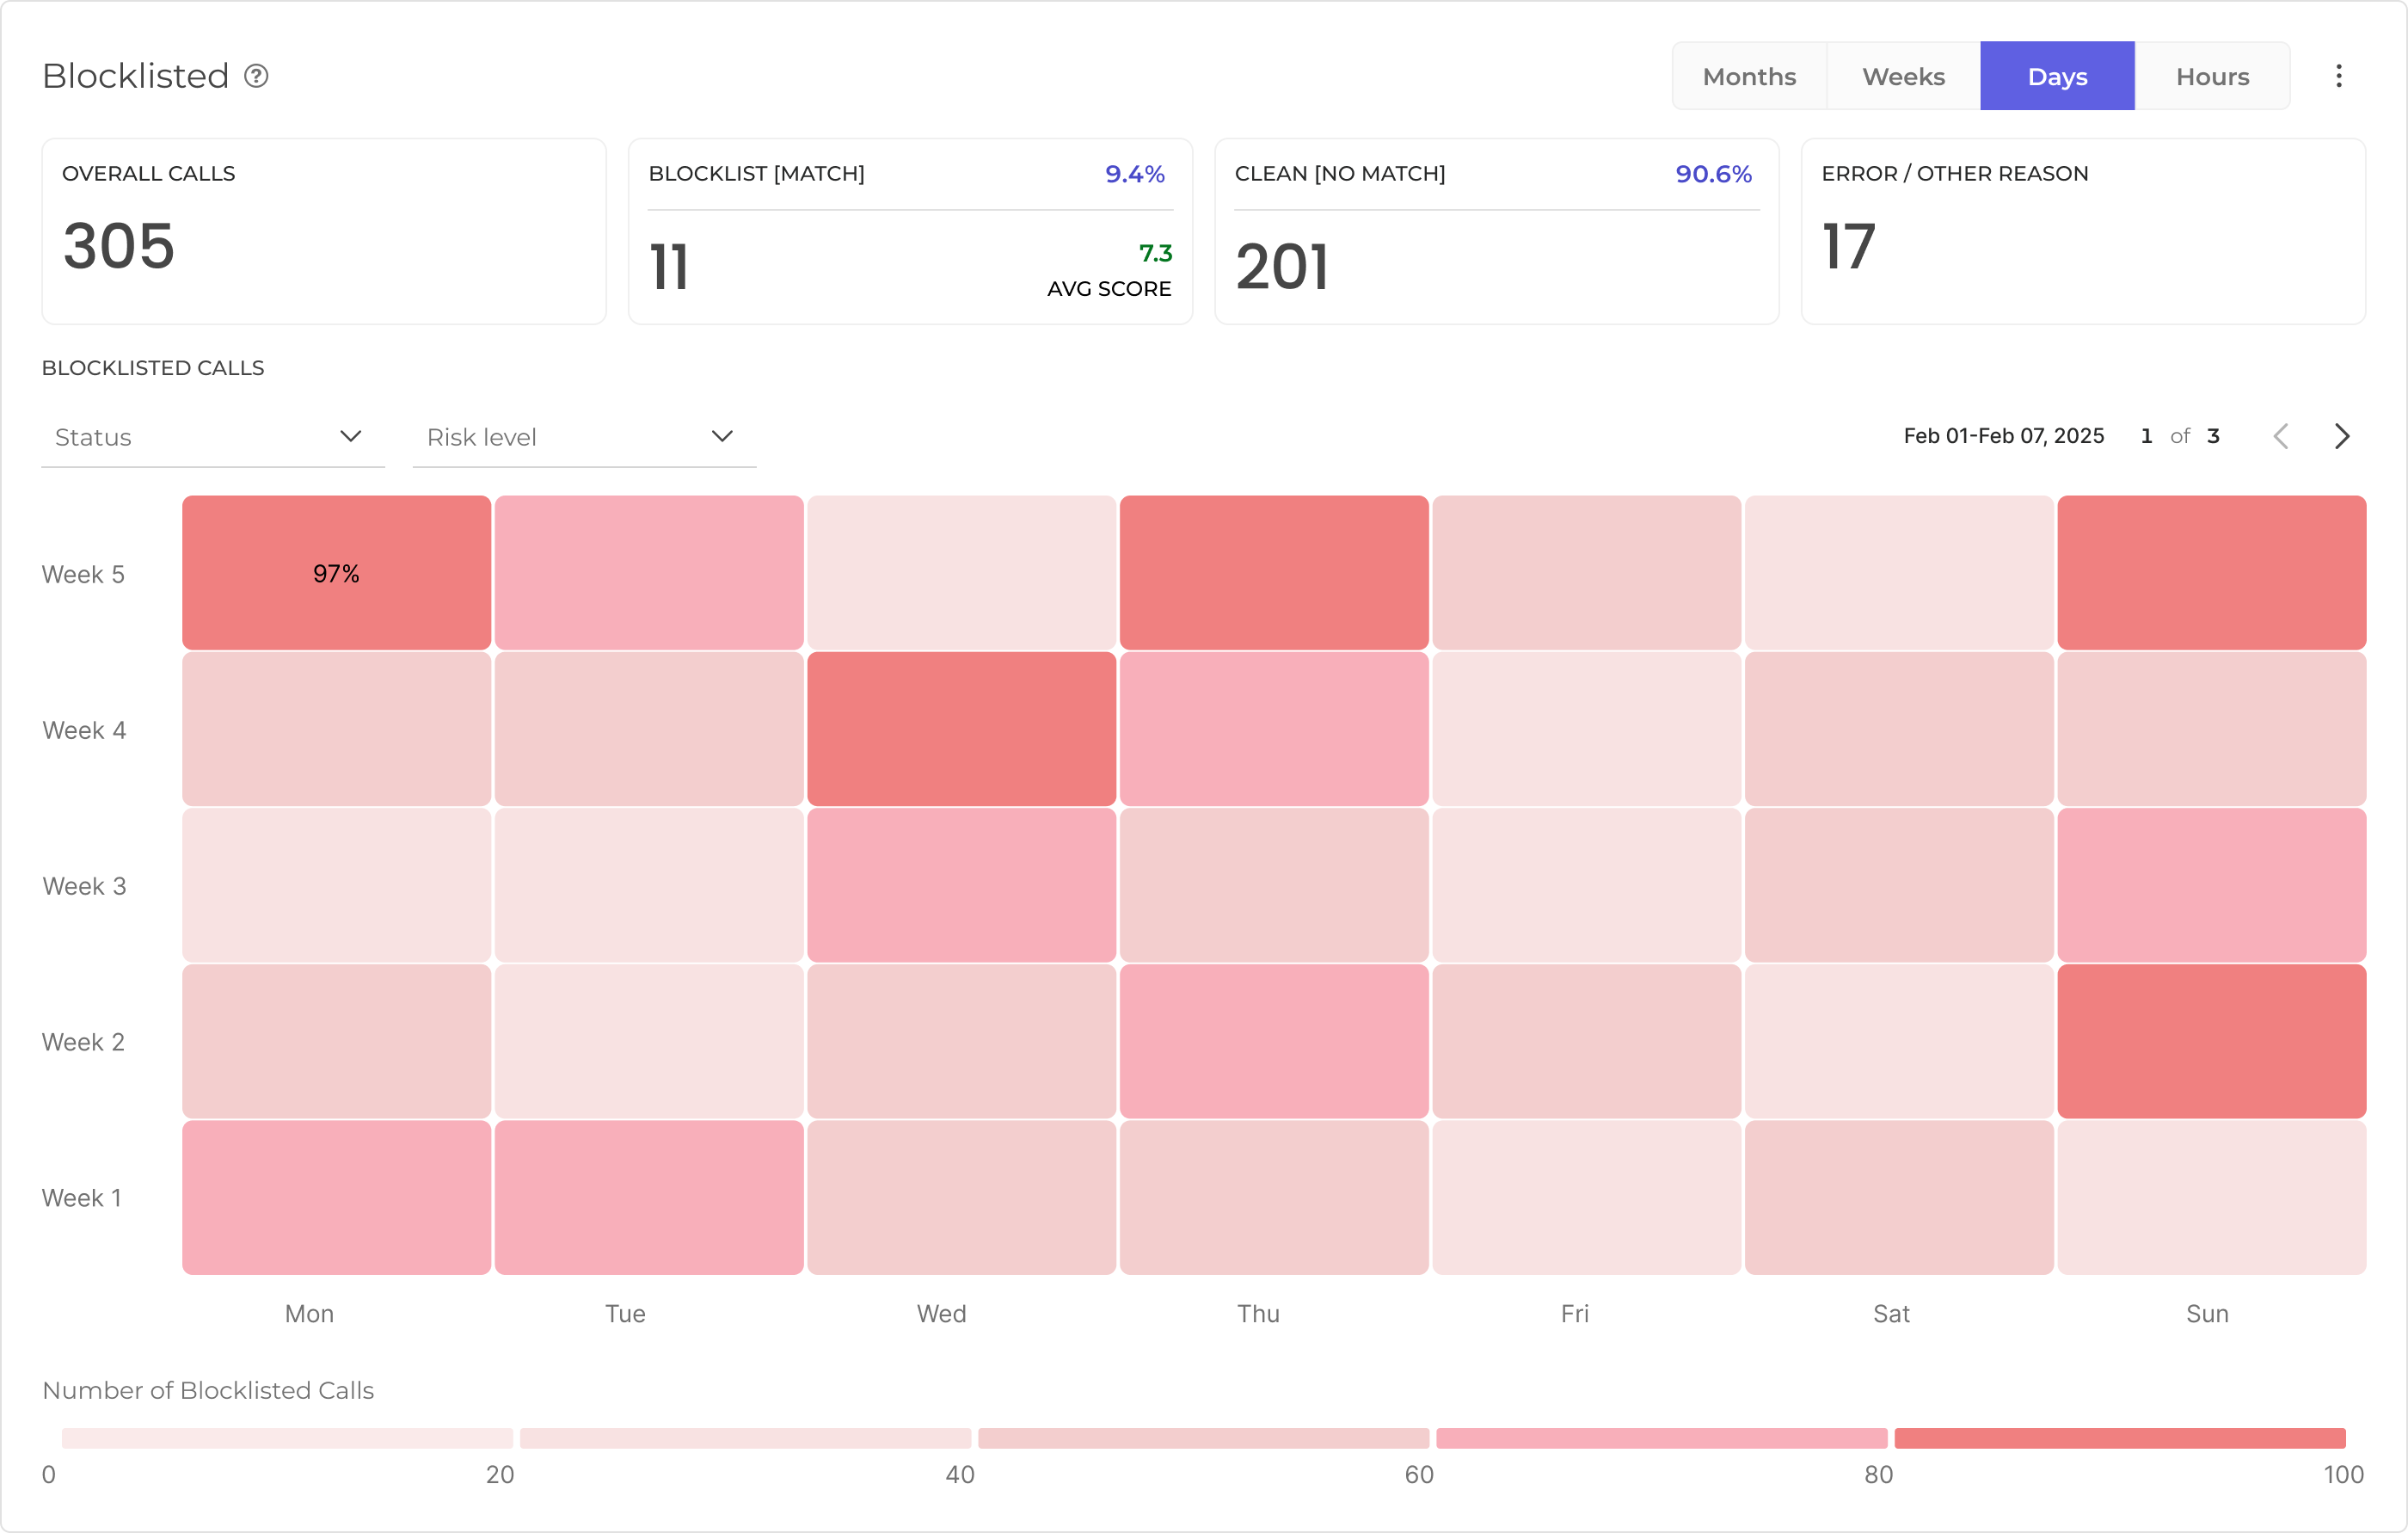
Blocklisting Report
OCP Reporting now includes dedicated visibility into Blocklisting outcomes at the call level. This helps customers understand how often known bad actors are being detected, whether activity is increasing over time, and where blocklisted calls are appearing across groups, regions, and supported origin dimensions.
Blocklisting identifies whether an incoming caller’s voice matches a voiceprint associated with a known fraudster or otherwise blocked identity. This helps organizations recognize repeat bad actors even if they attempt to call again using a different claimed identity
The reporting delivered in this scope is designed to provide:
-
Call-level blocklist outcomes (match / no match)
-
Visibility into counts and trends of blocklist matches over time
-
Filtering/segmentation by supported operational dimensions (for example group, region, call origin)
-
Trend-based reporting across selected periods to monitor recurrenceThis reporting update is about visibility and analytics. It does not change blocklisting decision logic during the call.
Best use case
Use Blocklisting reporting to monitor recurrence patterns and operational hotspots. For individual-call investigation, use monitoring tools in combination with reporting.
This report is about visibility and analytics. It does not change blocklisting decision logic during the call.
Advanced Conversational Insights
More detailed advanced metrics for the full application history may be found in Advanced OCP Conversational Insights®.
Metrics API
Insights Report Metrics with corresponding filters are also available through the Metrics API.