.svg)
17 - OCP Conversational Insights® Overview
In this tutorial, we are going to take a look at the default analytics that OCP® offers.
OCP Conversational Insights® provides rich, graphical dashboards with key performance metrics and come directly from the system without any analysis from a human.
There are several dashboards that help you identify how your applications are performing and point out possible improvements.
Below you can find information on each dashboard:
Total Sessions
Sessions
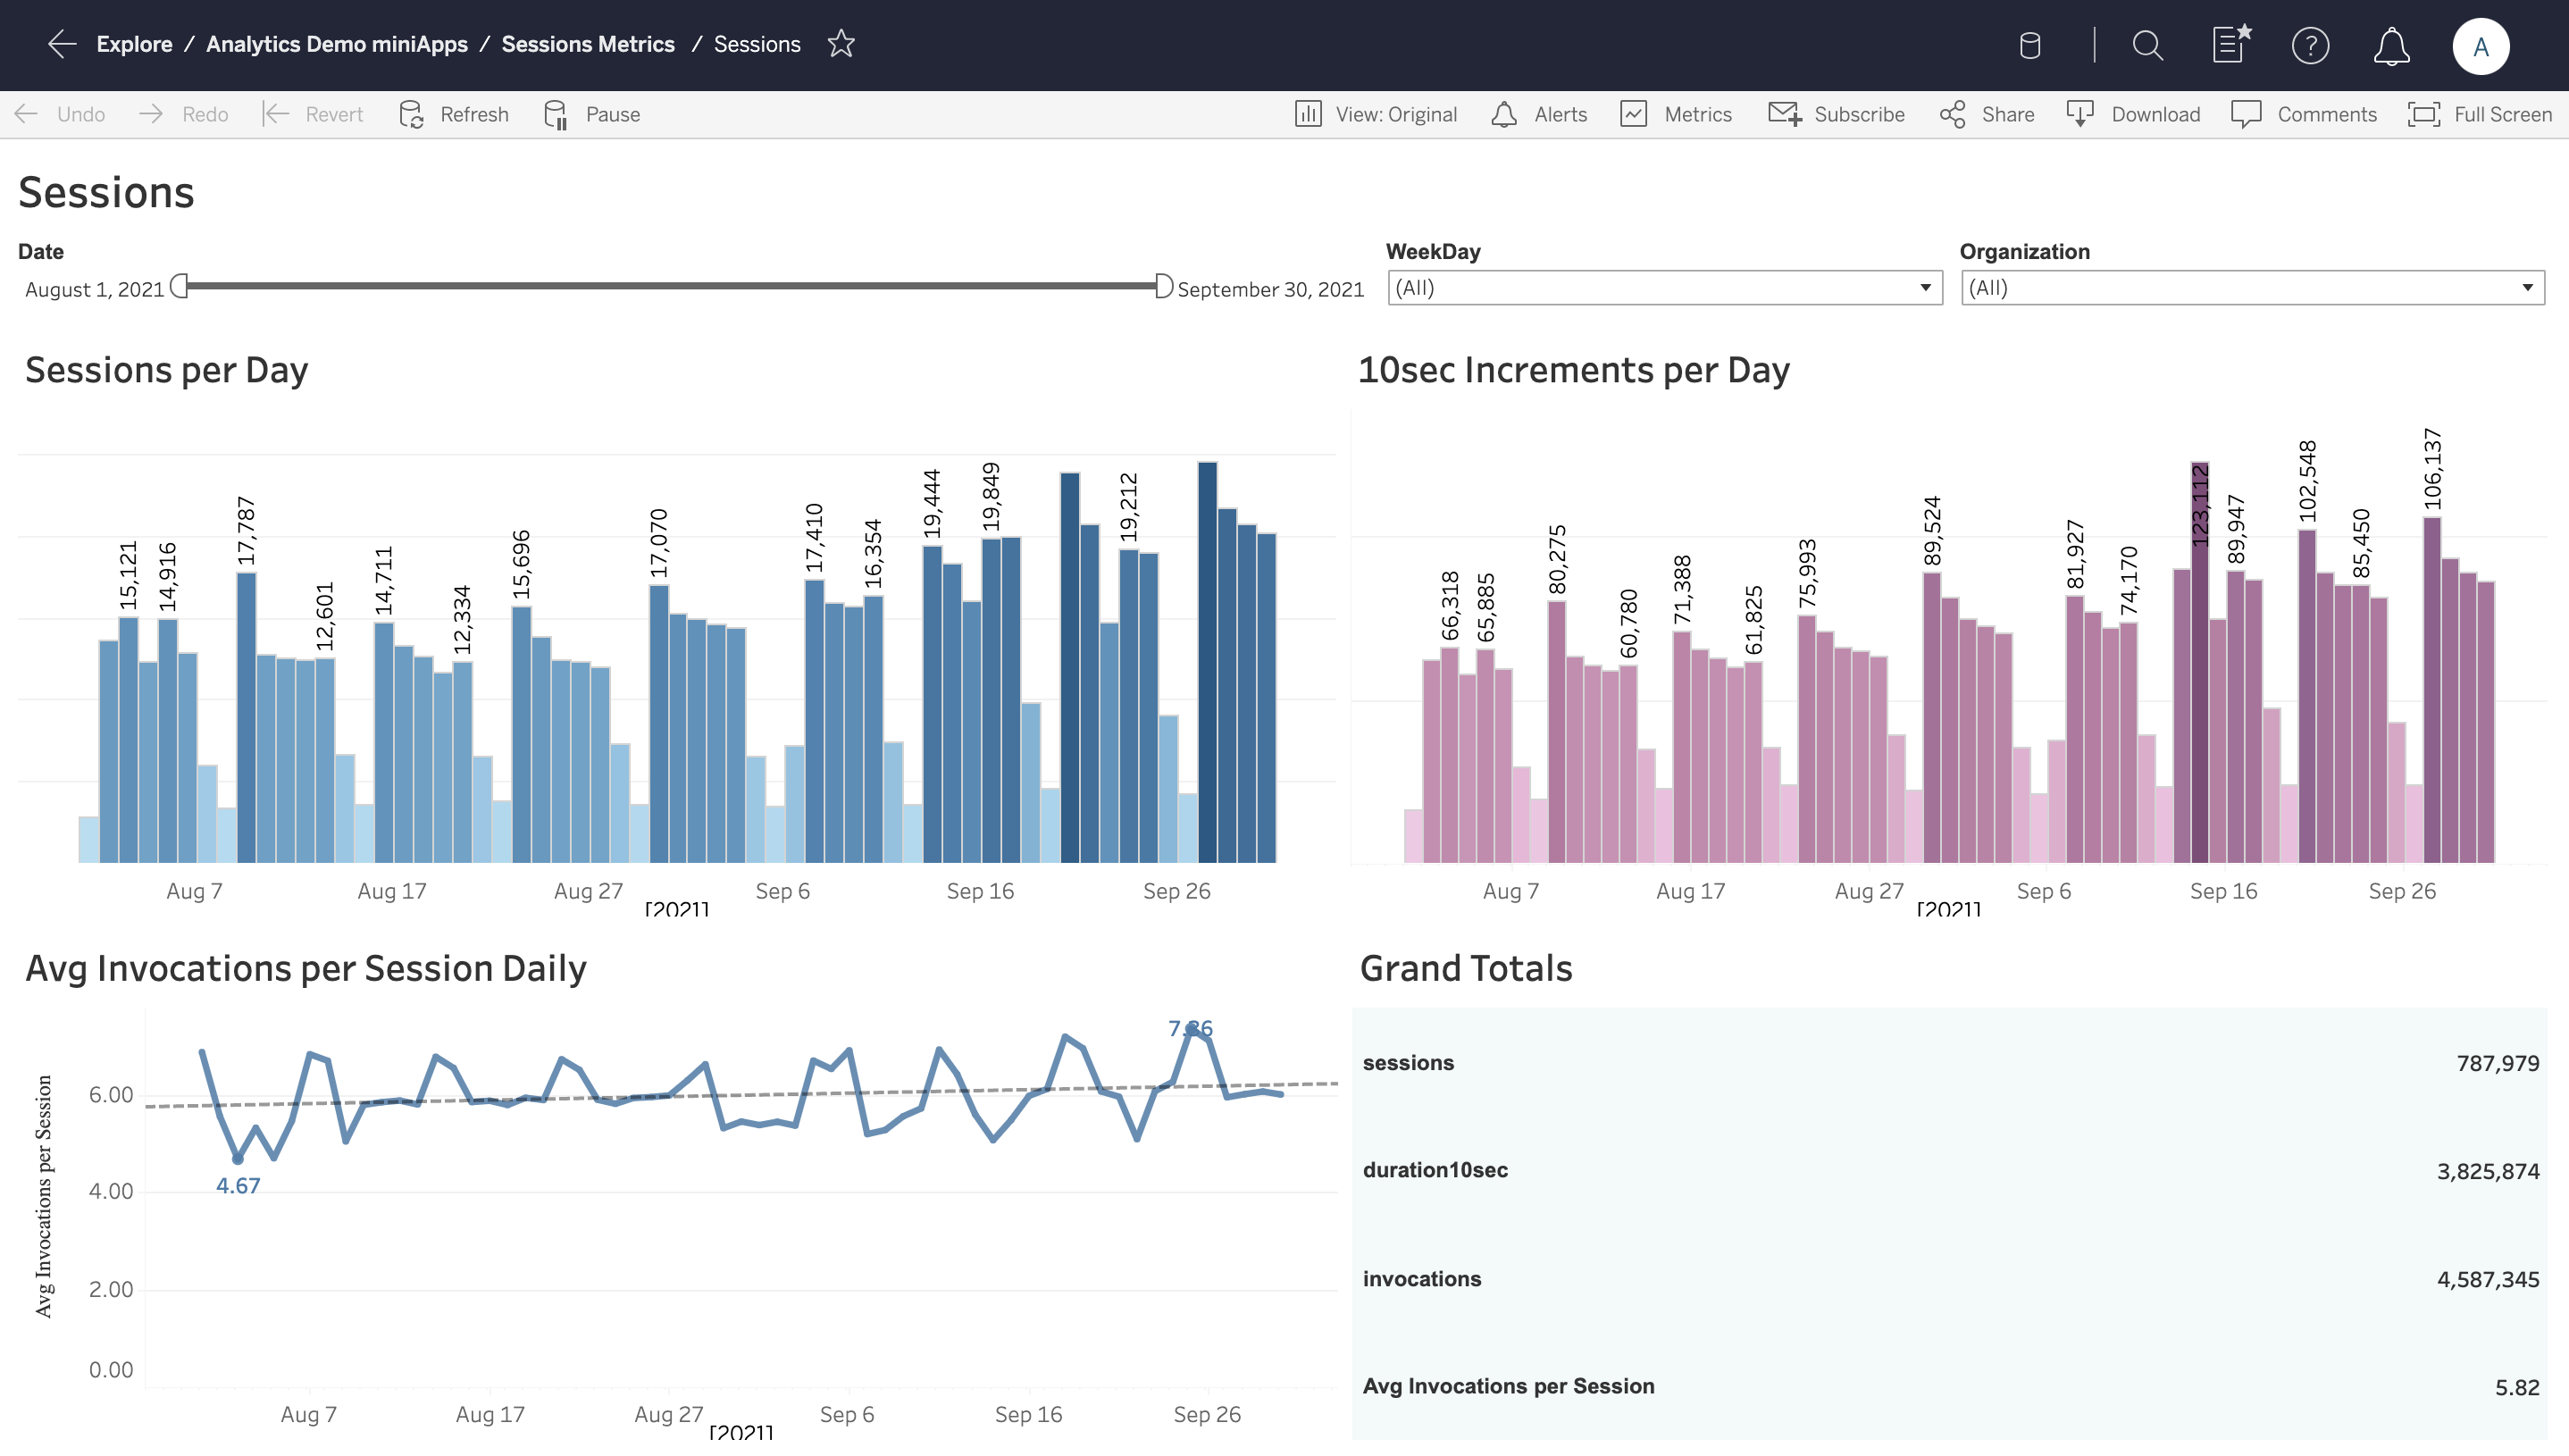
The Total Sessions interactive visualization shows:
The number of sessions that a customer is receiving,
The correspondence of these sessions with the underlying miniApps invoked.
The Sessions per Day graph displays the number of daily sessions for the selected period. The 10-sec Increments per Day graph breaks down the duration of the sessions into 10-sec increments and computes the average of all sessions on a daily basis. The Avg Invocations per Session Daily graph connects sessions to miniApp invocations. The Grand Totals board on the bottom right sums up in numbers the results presented in the previous graphs.
The filters on the top of the view can be used to adjust the visualizations by:
Day
Weekday
Organization - the group that the miniApps and Flow resources are assigned to when created in an OCP® instance.
Conversational Outcome
The Conversational Outcome dashboard allows observing the following key concepts:
Number of total dialogs per day
Number of dialogs Contained/Abandoned/Transferred/Error/Other
No Matches & No Inputs per dialog per day
Conversational Outcome
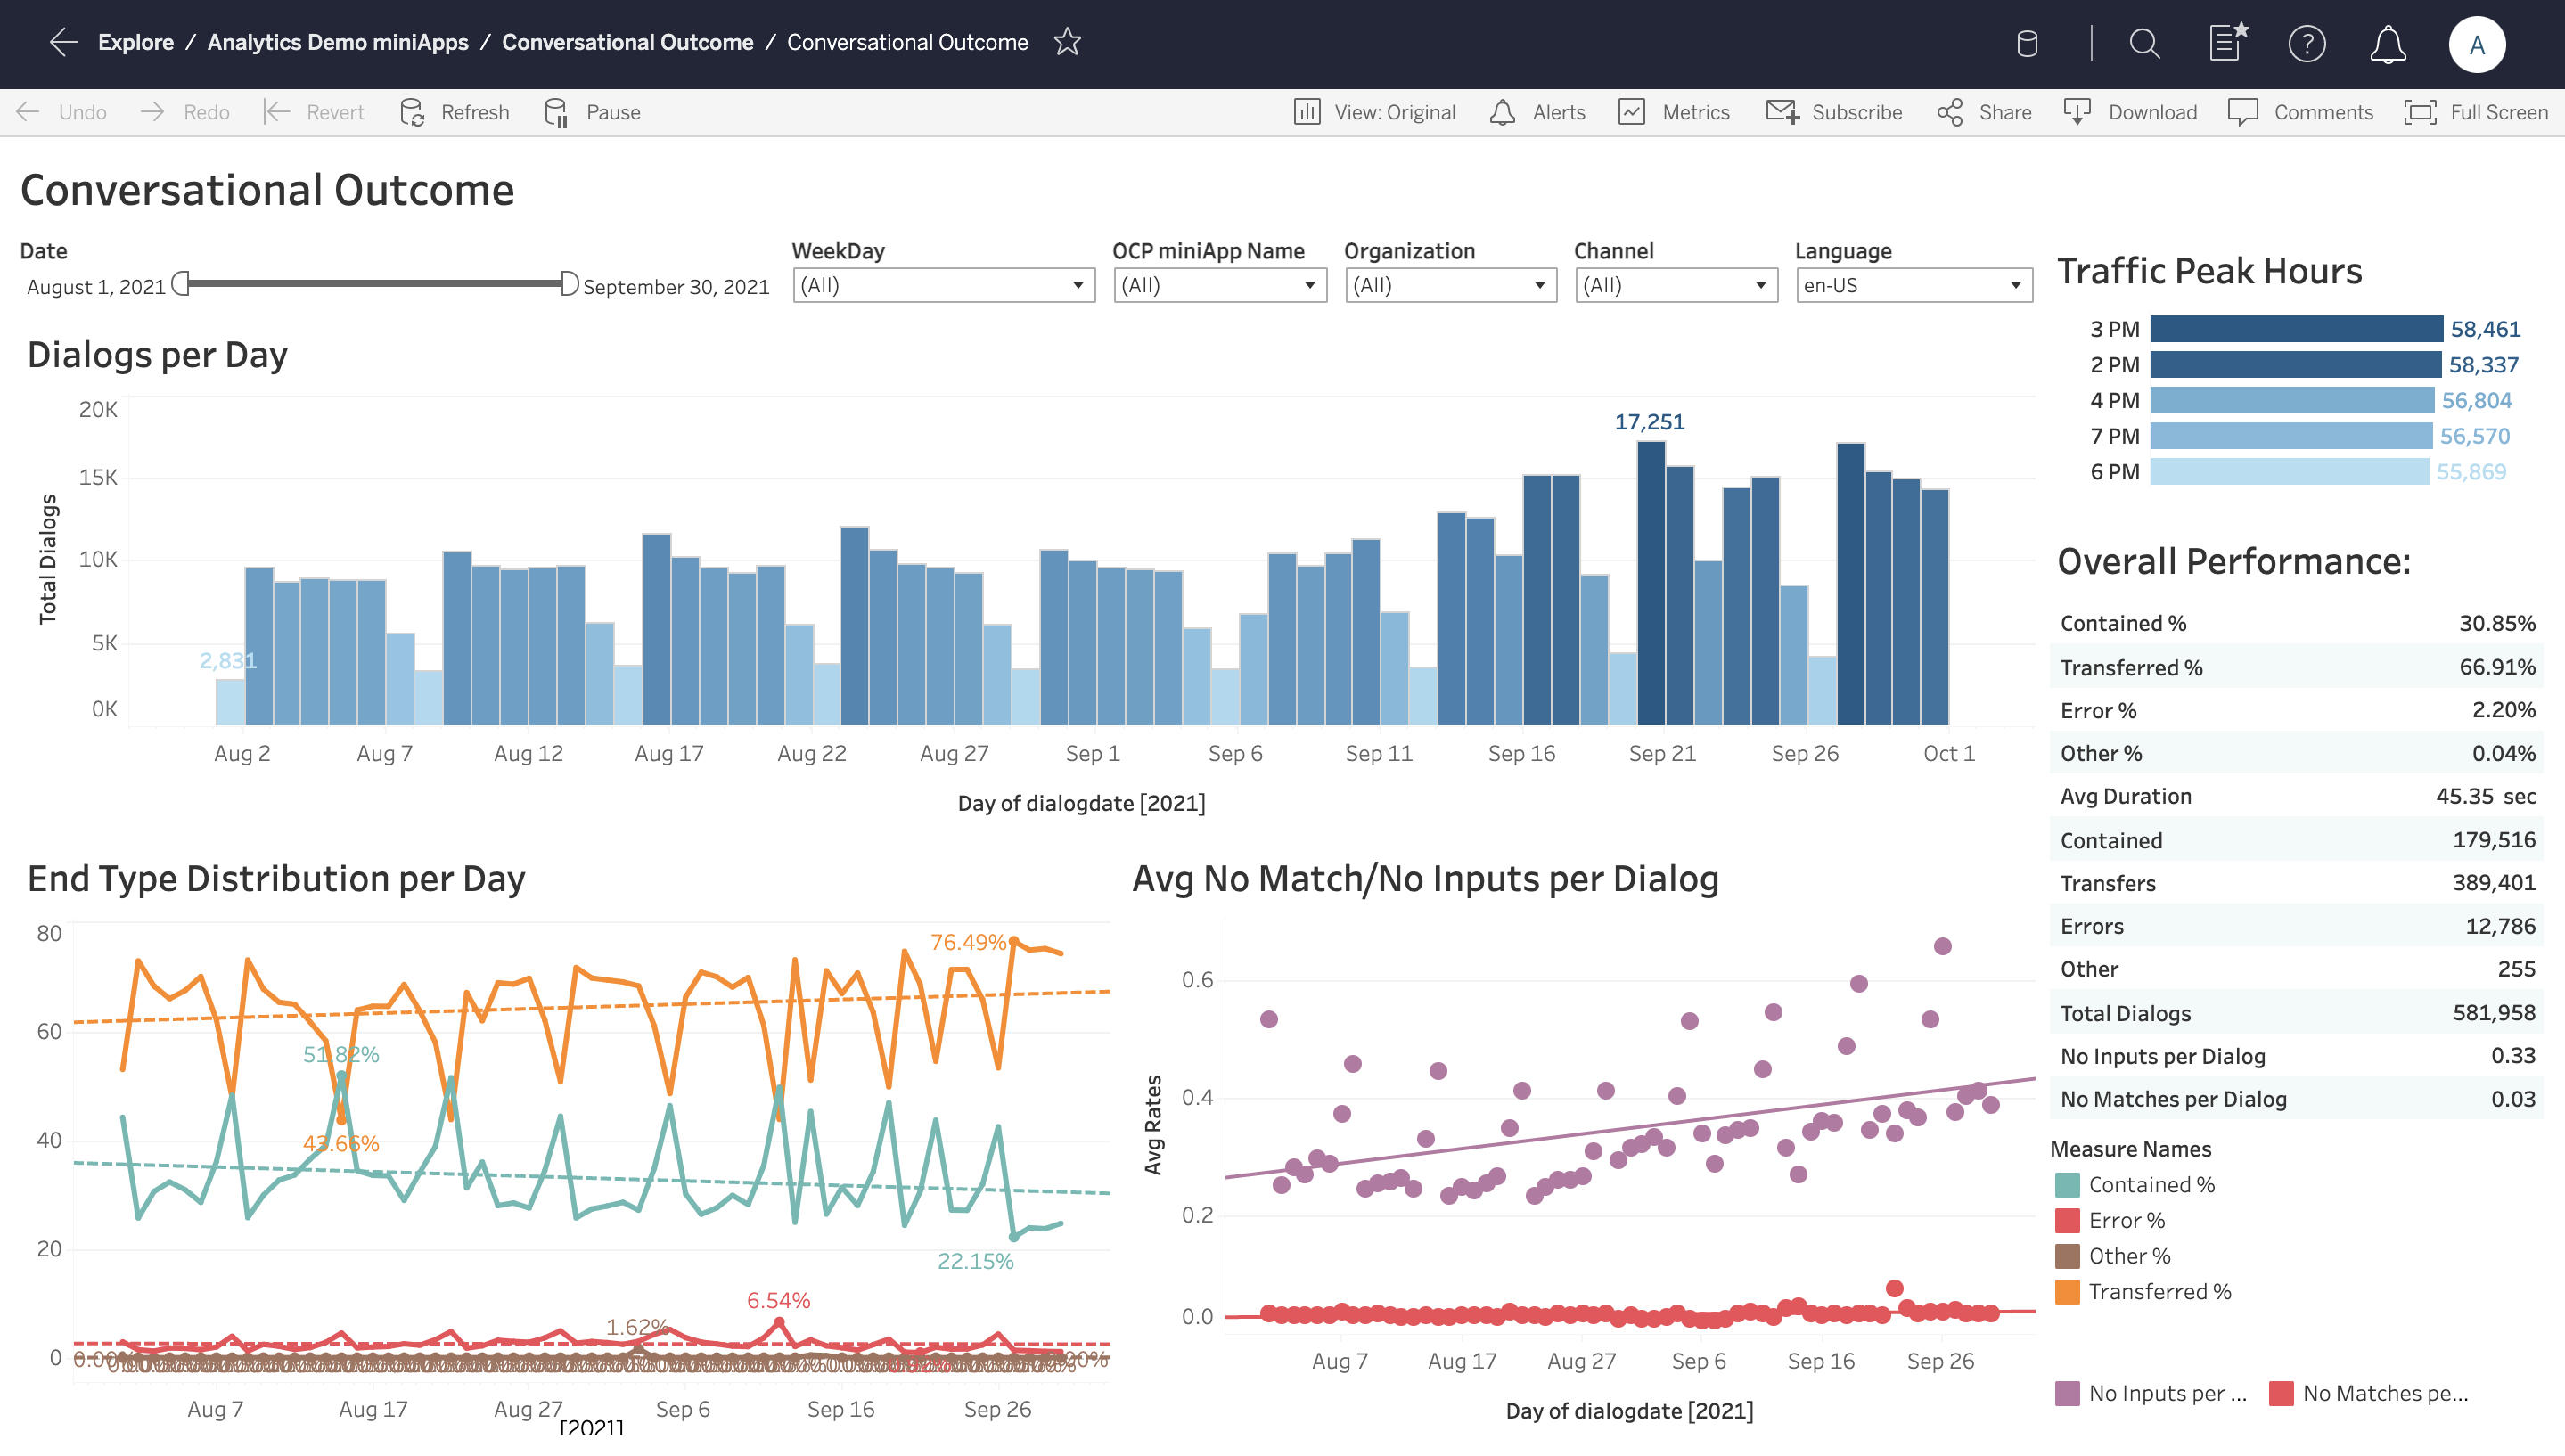
The Dialogs per Day graph shows the total number of calls per day. As you can see from the statistics above, the traffic on Sundays is much lower than on any other day.
The Traffic Peak Hours graph displays when the system is getting the highest call volume.
The Overall Performance graph reveals the most important factors that influence the overall performance of the miniApps. The data is presented both in numbers and percentages.
Contained - how many dialogs have been terminated by the user or system without getting transferred and at least one subflow (self-service) was completed successfully.
Abandoned - how many dialogs have been terminated by the user or system without getting transferred and no subflow (self-service) was completed successfully.
Transferred - how many dialogs have been transferred out of the system, which means, were not terminated.
Errors - how many dialogs have been completed with an error.
Other - dialogs which are not classified in any of the above cases. This should be zero. If not, these cases need further investigation.
Avg No Match/No Inputs per Dialog contains the data on when and how many corresponding incidents took place.
End Type Distribution per Day provides the percentage of calls that have been either transferred, or contained, or ended due to an error within 24 hours.
You can also easily customize specific filters located on an upper bar according to such criteria:
Date - the date when the call took place.
Weekday - the day of the week when the call took place.
miniApp Name - the name of the miniApp as defined when the resource was created in OCP®. One miniApp can be invoked in several different conversations in an OCP® application. This filtering will adjust the view to show exactly these. This name differs from the id (the unique identifier) and is always unique per organization.
Organization - the group that the miniApp is assigned to when created in an OCP® instance.
Channel - the channel through which the conversation occurred.
Language - the language of the miniApps invoked by the dialogs under review. A miniApp is multilingual, so this filter can work by itself without adjusting the miniApp Name at the same time.
Self Services Success Rate
Self-Services Success Rate
This visualization reports the total success rate of the application’s self-services:
Total Self Services - a number of total self-services. A self-service may invoke several underlying miniApps.
Success Rate - a number of successful self-services over a total number of flows. By default, a self-service is successful if all its underlying miniApps are successful. Custom logic on top of this can be applied through Orchestrator UI.
Filters available to adjust the views:
Group - the resource group that miniApps or Flows belong to.
Language - the language of the miniApps.
miniApp Type - the types of the miniApps to be reviewed.
miniApp Name - the names of the miniApps to be reviewed.
DateTime - the time period under review.
Task Reports
miniApps Invocations KPIs
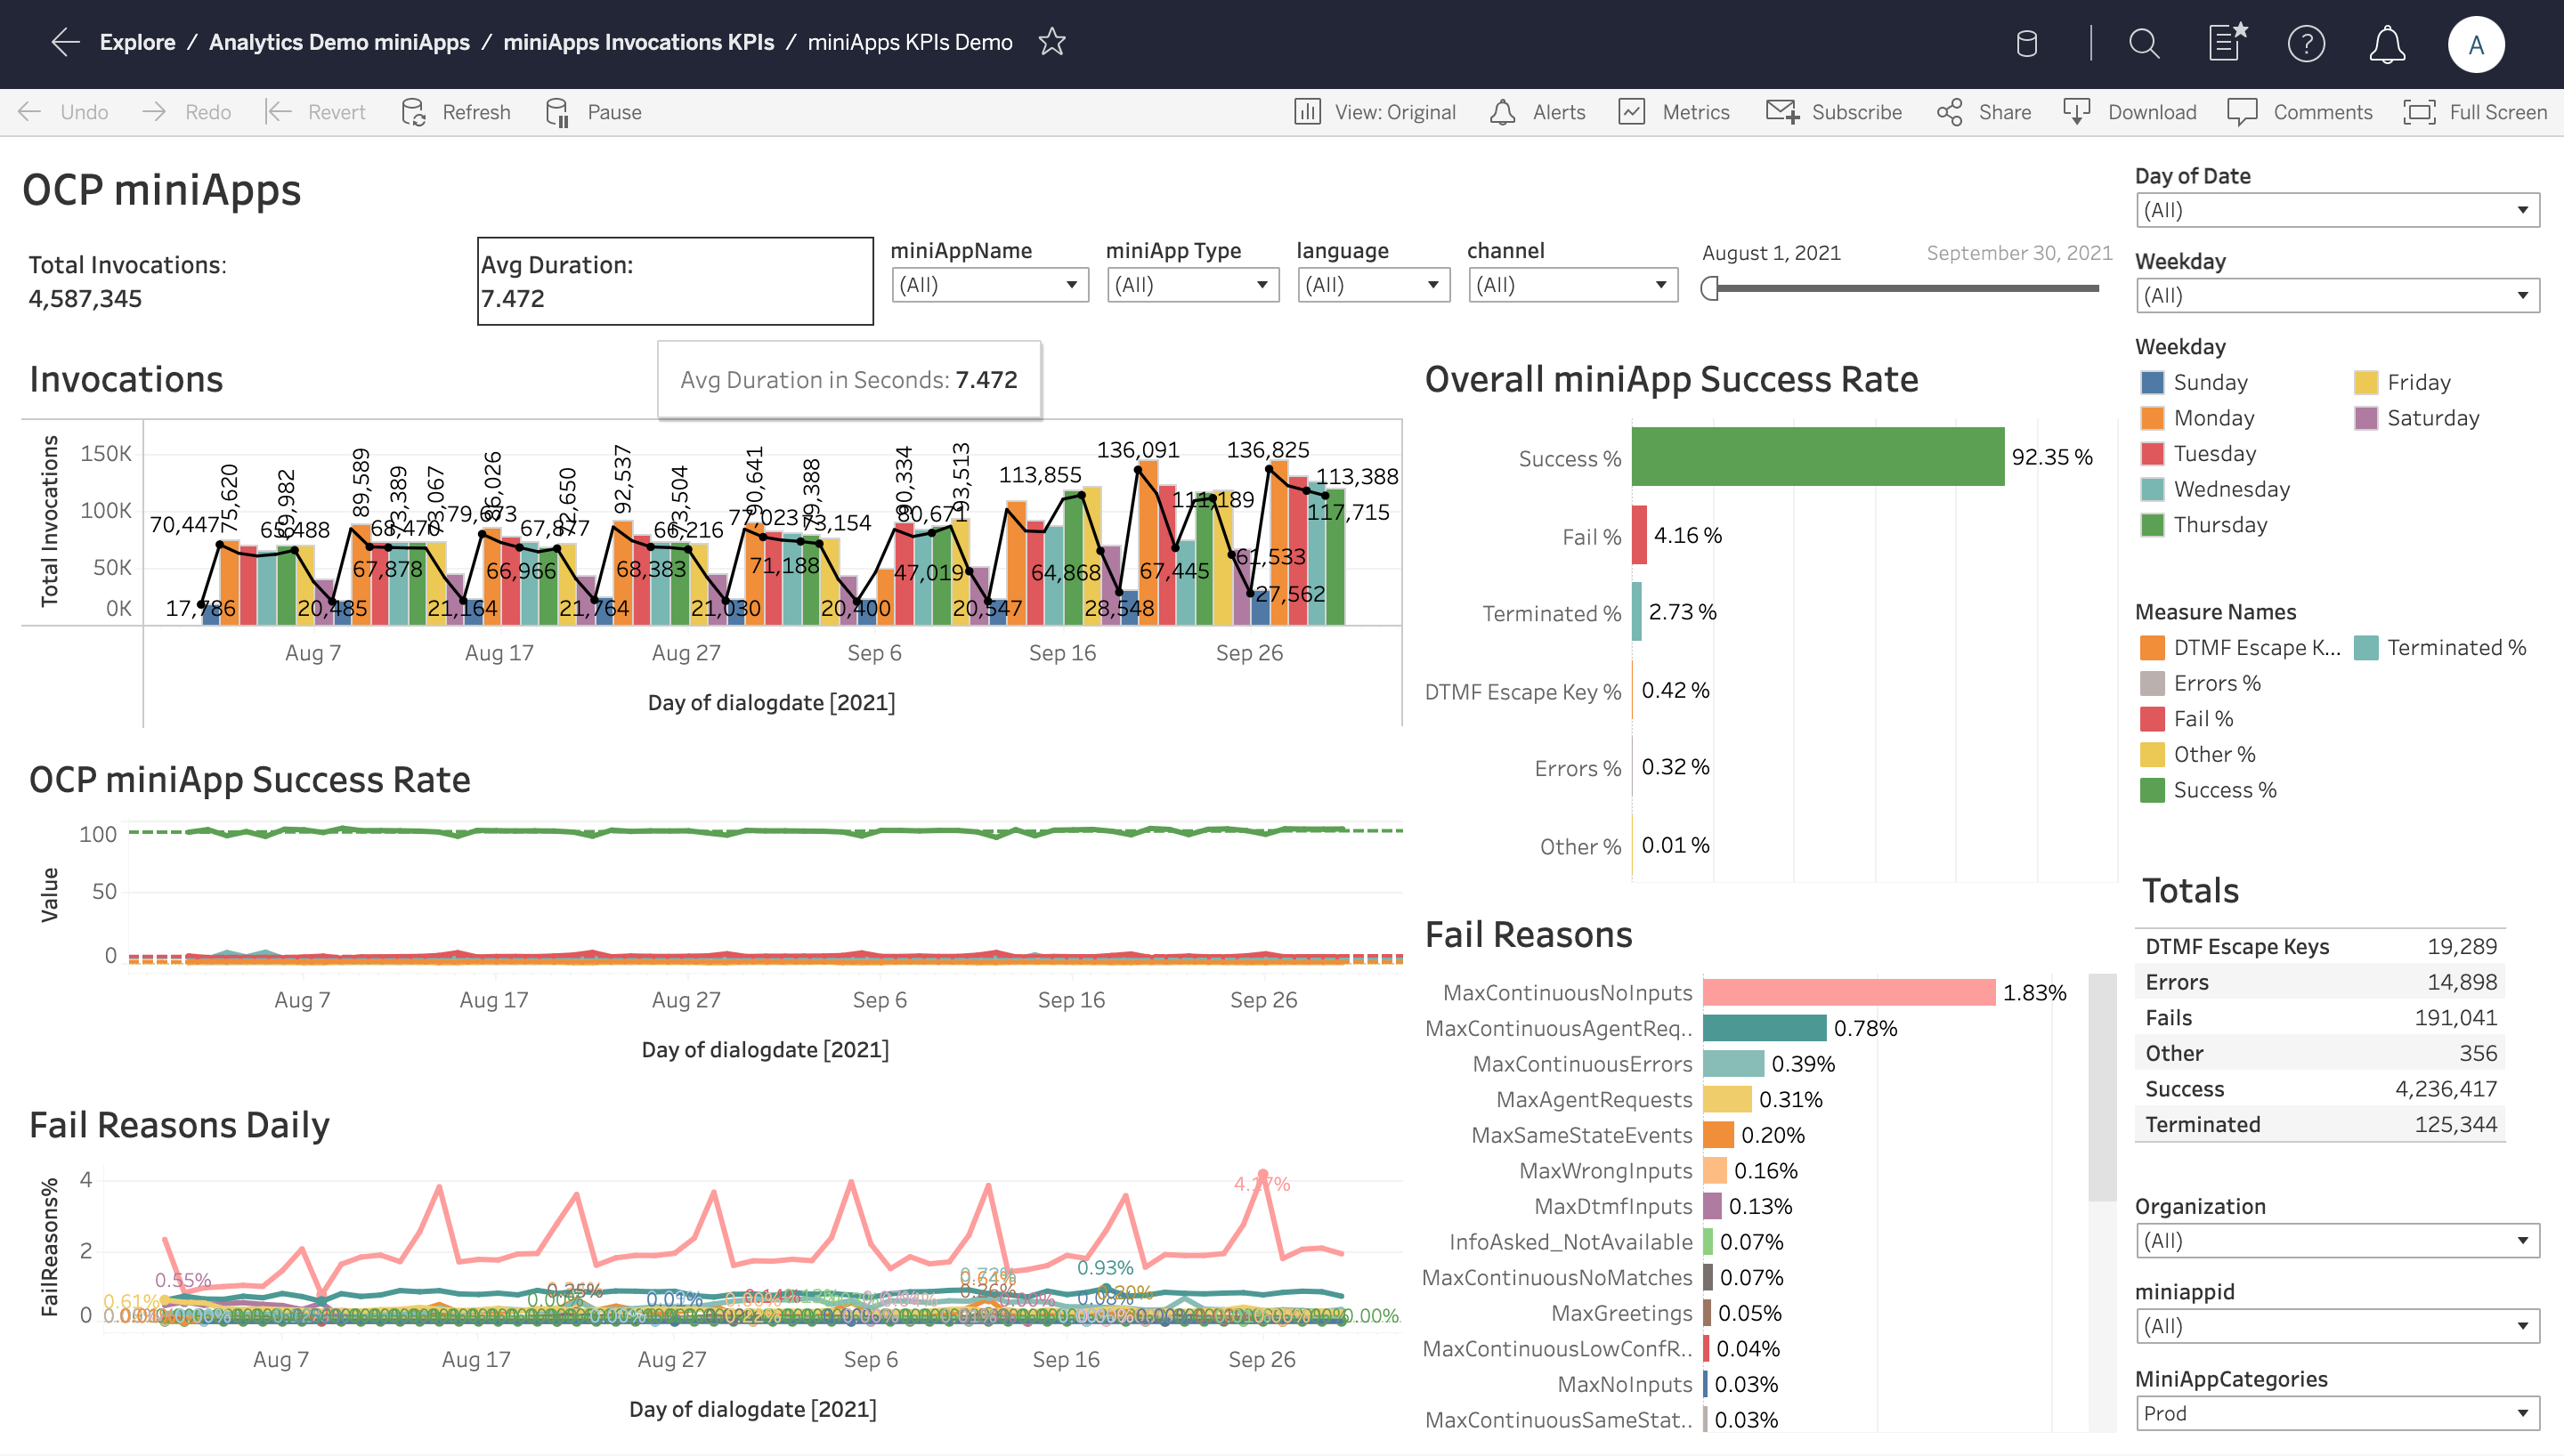
On the top of the dashboard, you can see the average duration of each miniApp invocation.
The Invocations graph shows the total miniApp invocations on a daily basis. The embedded black line corresponds to the successful invocations on each day.
The OCP miniApp Success Rate graph shows the success and failure rates of the selected miniApps. This is the task completion rate of each miniApp, which breaks down in the Overall miniApp Success Rate graph to:
Successful Invocations - the percentage of successful invocations over the total number of invocations on a daily basis.
Failed Invocations - the percentage of failed invocations over the total number of invocations on a daily basis.
Terminated - the percentage of terminated (either by the user or by the system) invocations over the total number of invocations on a daily basis.
DTMF Escape Key - the total number of invocations within which the user opted out using the DTMF escape key over the total number of invocations on a daily basis.
Errors - the total number of invocations with at least one system error over the total number of invocations on a per-day basis.
Other - a final categorization that captures all invocations not falling in the above categories. These may include yet unclassified errors or edge cases.
Apart from a daily distribution, these metrics are also shown as cumulative over the selected period.
The Fail Reasons Daily dashboard shows the fail reasons for all the failed miniApps invocations distributed on a daily basis together with the cumulative percentages spanning over the selected time period.
Finally, a table on the right of the dashboard shows a summary of all the metrics.
You can also filter the data according to specific parameters on the upper panel:
Date - the date when the call took place.
Weekday - the day of the week when the call took place.
miniApp Name - the names of the miniApps to be reviewed.
miniApp ID - the unique ID of a miniApp.
miniApp Type - the type of a miniApp: Alphanumeric, Numeric, Intent, and so on.
Organization - the group that the miniApp is assigned to when created in an OCP® instance.
Channel - the channel through which the conversation occurred.
Language - the language of the miniApps.
Intents Distribution and Utterances
Intents Distribution and Utterances
This dashboard analyzes the application’s Intents distribution as these are recognized by the corresponding miniApps, on a daily basis. Moreover, most frequent utterances are bound with each intent.
The metrics shown in the report are as follows:
Cumulative Intents Distribution - total Intents distribution cumulated over the selected time period.
Top Utterances per Intent - top 10 utterances per intent together with the distribution.
Intents Distribution Absolute - absolute count of each intent on a daily/hourly basis.
Intents Distribution Percentage -the percentage of each selected intent over the total intent requests on a daily/hourly basis.
You can customize specific filters to such criteria:
Organization - the group that the miniApp is assigned to when created in an OCP® instance.
Language - the language of the miniApps.
miniApp Type - the type of a miniApp: Alphanumeric, Numeric, Intent, and so on.
miniApp Name - the names of the miniApps to be reviewed.
DateTime - the time period under review.
Custom Metrics
Custom Metrics reporting shows custom loggings of an Orchestrator application as these are set through the OCP Console® UI.
The goal is to enable the tracking of specific custom events necessary for the monitoring of the application. These events are key-value pairs and are logged through the OCP Console® UI. Their various combinations are aggregated in the underlying data warehouse engine on a daily basis and are served in the visualization layer. The Number of Attempts graph shows how many times the same custom logging has appeared within the same miniApp during the same invocation.
You can adjust the view using the following filters:
Channel - the channel through which the conversation occurred.
Language - the language of the miniApps.
miniApp Name - the names of the miniApps to be reviewed.
DateTime - the time period under review.
Metrics - This filter can be used in order to focus on specific metrics or their combinations.
Self-Service Contribution
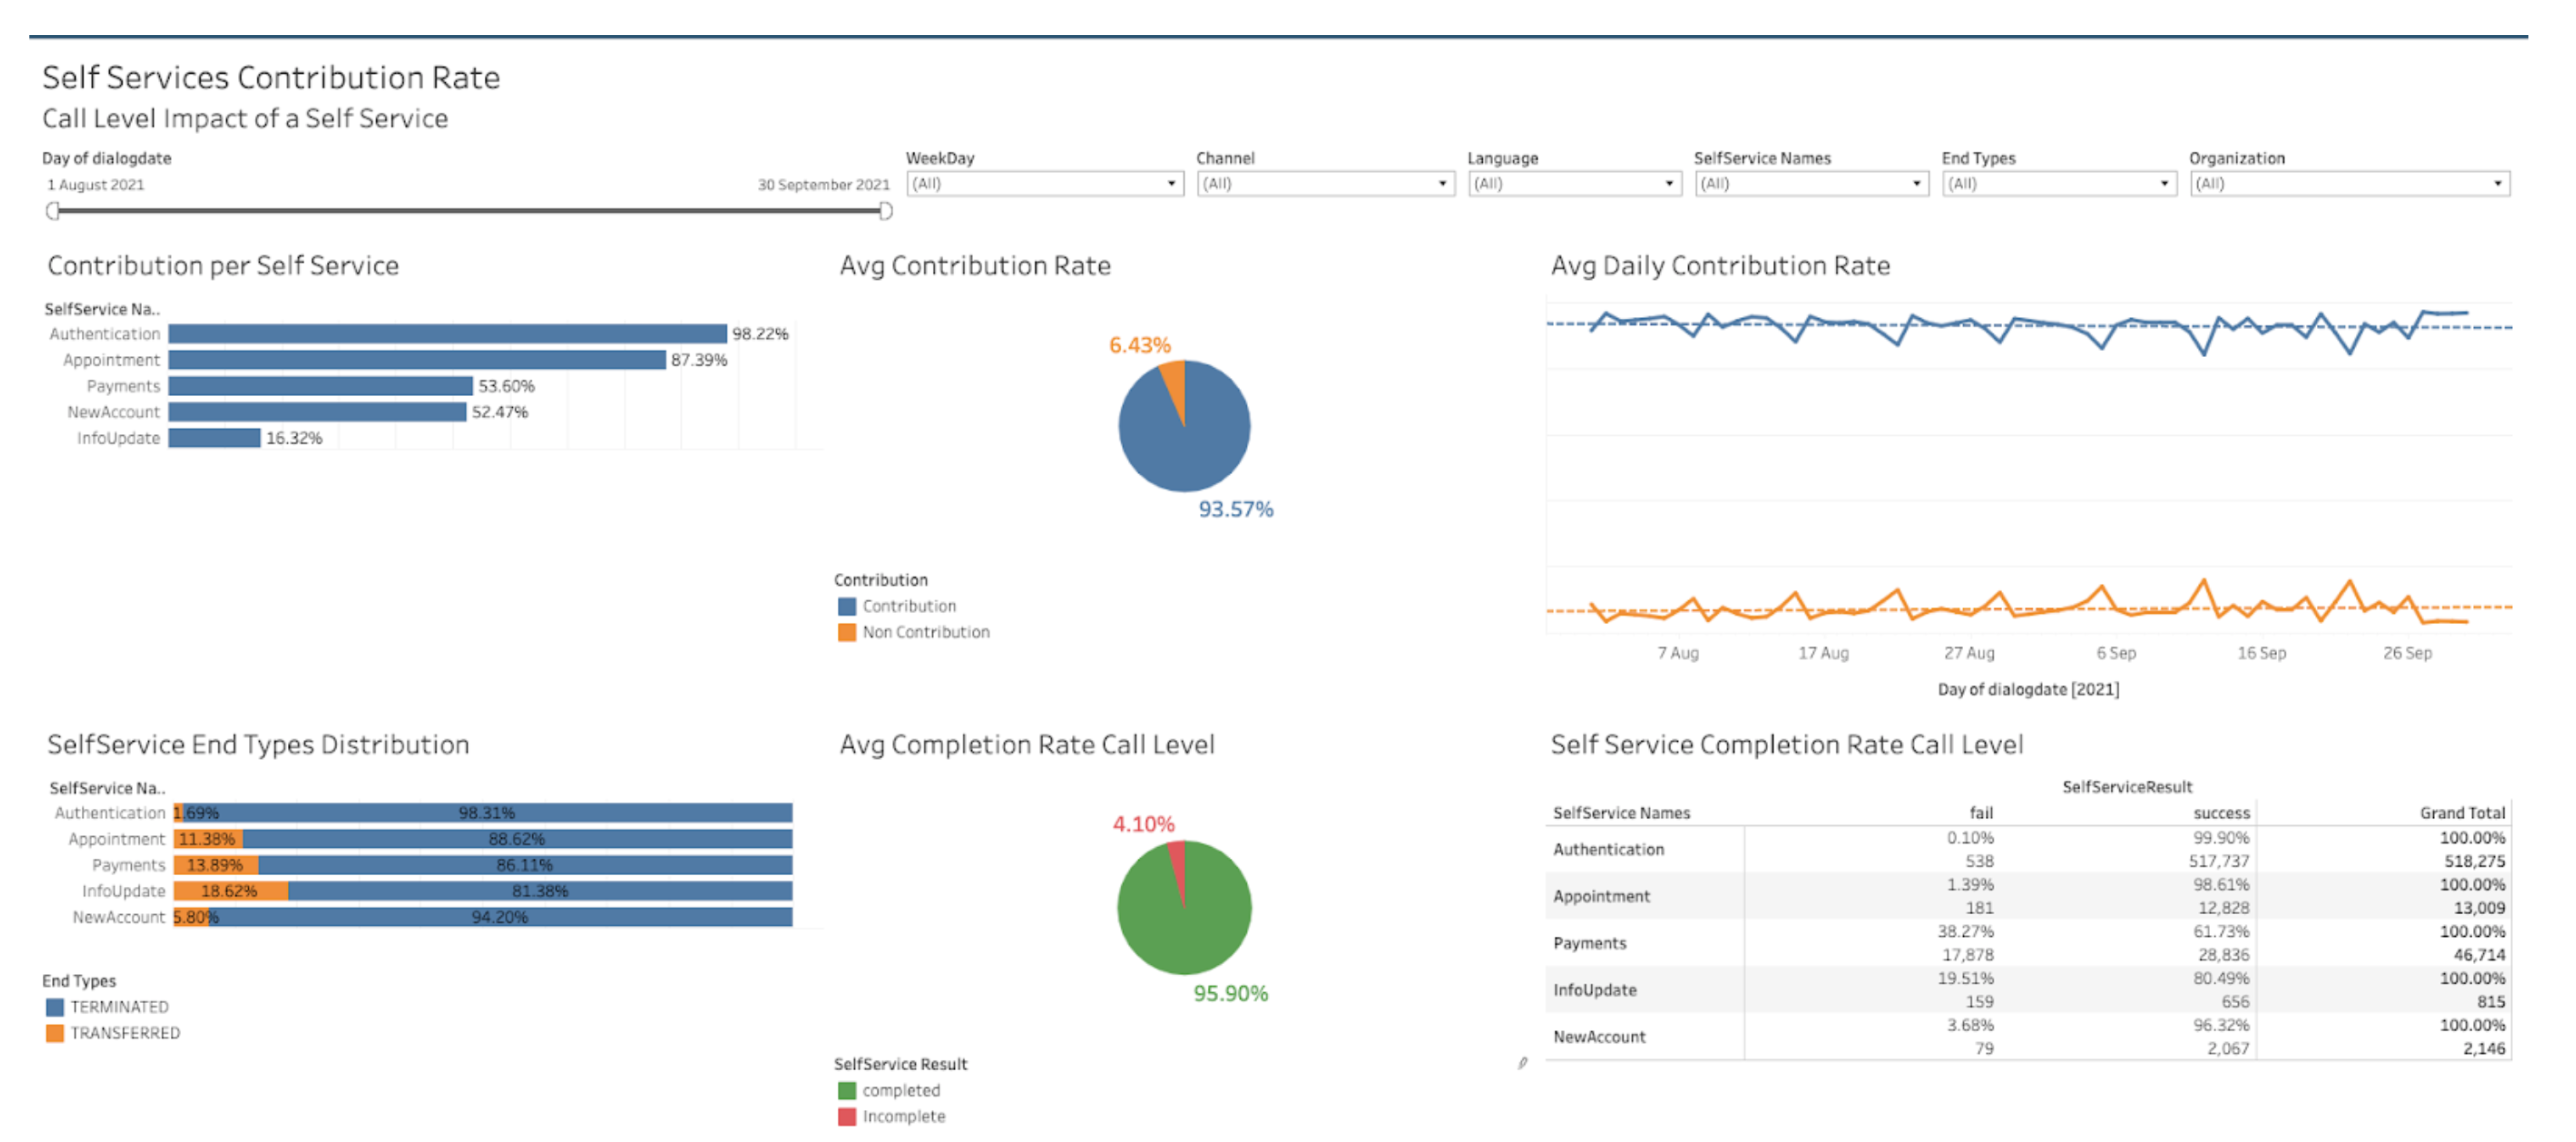
Self-Service Contribution Rate displays the call level success rate of the self-services of the application. Also, it shows the contribution “impact” of each self-service in the conversation outcome (Transferred vs. Terminated). The same self-service may be triggered multiple times, so this Dashboard focuses on calls that contain the self-services at least once.
The metrics shown in the report are as follows:
Contribution Rate - number of total calls with self-services, that the Self Service was completed at least once successfully, and the call was terminated (either by the user or the system).
Completion Rate - number of calls with at least one successful self-service.
End Types Distribution - number of calls with at least one self-service, Terminated vs. Transferred.
You can adjust the filters according to the criteria below:
Organization - the group that the miniApp is assigned to when created in an OCP® instance.
Weekday - filtering according to the day of the week.
Channel - the channel through which the conversation occurred.
Language - the language of the miniApps.
End Type - the outcome of the conversation, either Terminated or Transferred.
Self-Service Name - the name of the self-service of the application.
Transfer Reasons
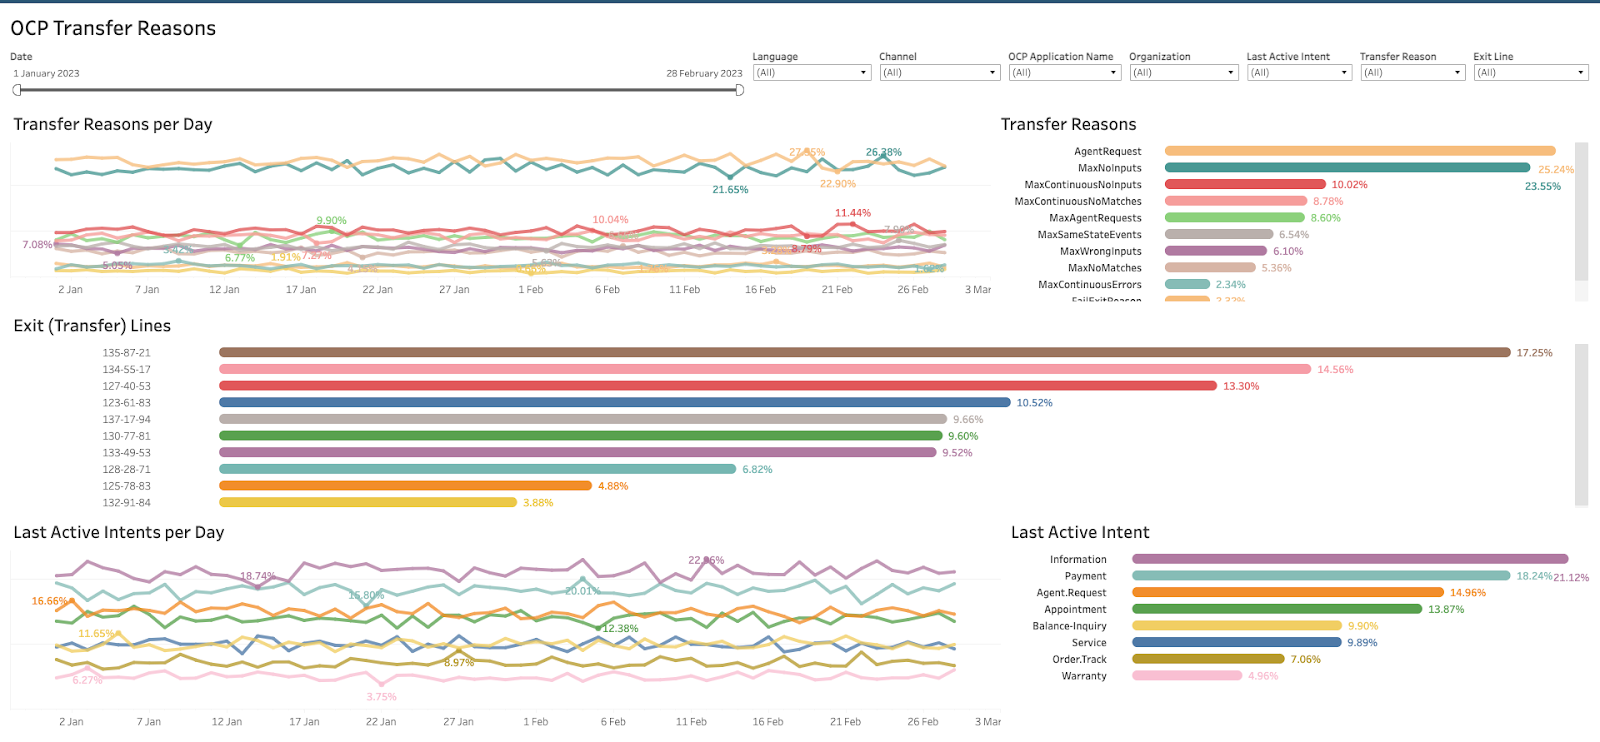
The Transfer Reasons dashboard provides an overview of all the calls that were transferred out from the OCP IVR and reached a call center agent. You can use this dashboard to:
prioritize enhancements based on the transfer reasons,
provide possible new announcements or self-services based on the last active intent, and
gain an understanding of which transfer lines receive higher call volumes.
The metrics shown in the report are the following:
Transfer Reasons - daily and overall distribution of transfer reasons. For example, Agent Asked, Max Errors, Transfer Out Intent.
Exit (Transfer) Line - distribution of calls per each different transfer line the Omilia IVR transferred the call to.
Last Active Intent - distribution of the call level intents, regarding the last intent extracted in these calls before they were transferred out. If no intent was requested by the caller within the call the last active Intent would be Undefined.
You can adjust the filters according to the criteria below:
Organization - the group that the miniApp is assigned to when created in an OCP® instance.
Date - the date when the call took place.
Channel - the channel through which the conversation occurred.
Language - the locale of the miniApps.
Last Active Intent - the last intent extracted in the call.
Exit Line (Transfer Line) - the transfer line to which the call was transferred.
Transfer Reason - the reason for the call transfer.
Caller Classification Reporting
This Caller Classification dashboard provides an overview of the caller's engagements inside an OCP IVR. All the calls that reach the OCP IVR are classified based on how the callers behave and how much they engage within the application.
The metrics shown in the report are as follows:
Power Users - number of calls that entered the IVR application, where the caller successfully requested an Intent without encountering any issues, such as no inputs, no matching results, or any agent requests during the entire call.
Engaged users - number of calls that entered the IVR application, and the caller did request an Intent but might have faced a challenge at a certain step, like having difficulty interacting with the application or remaining silent during the call.
Not engaged callers - number that entered the IVR application, but the callers did not express any specific intent while attempting to engage with the system.
Instant Calls - number of calls that entered the IVR application but were swiftly terminated or transferred right away, either upon the first system request or before the initial system query.
Silent Calls - number of calls that entered the IVR application, but throughout the call, there was no input or interaction from the user.
Agent Asked - number of calls that entered the IVR application where only agent was requested and no intent was provided, typically due to the caller’s refusal to cooperate with the application.
You can adjust the filters according to the criteria below:
Organization - the group that the miniApp is assigned to when created in an OCP instance.
End Type - the outcome of the conversation either Terminated or Transferred.
Date - the date when the call took place.
IVR Recaller Analysis
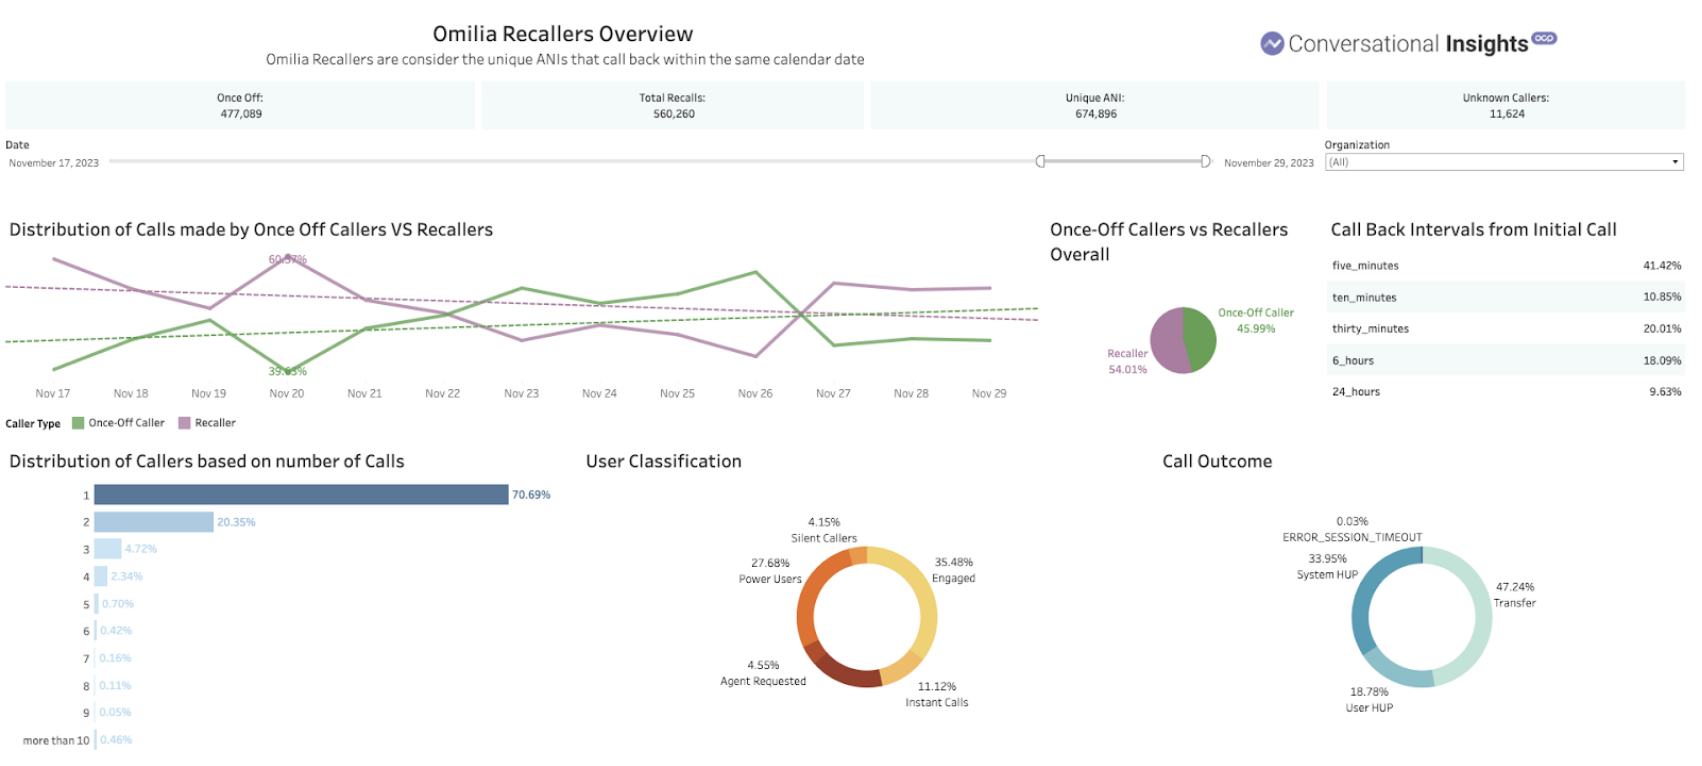
This visualization offers insights for OCP IVR users, specifically focusing on call recall patterns. Calls reaching the OCP IVR are analyzed based on the ANI initiating the callback. The recall timeframe spans a 24-hour window, aligned with the UTC calendar date (00:00 UTC - 00:00 UTC). Notably, Anonymous or Unknown ANI instances are excluded from the recall analysis, ensuring only valid ANI (phone numbers) are taken into account. The visualization also delves into distinct behavioral patterns exhibited by recallers in comparison to one-time callers, aiming to uncover motivations prompting repeated interactions with the application.
The metrics shown in the report are as follows:
Once Off Calls. Displays the number and percentage of calls originating from an ANI that called only once within a 24-hour period (for a given calendar date).
Recallers. Presents the number and percentage of calls from an ANI that made multiple calls within a 24-hour period (for a given calendar date).
Unknown. Indicates the number of calls initiated by an Unknown/Anonymous ANI (origin URI) to the application.
Call Back Rates. Illustrates the time interval from the initial call to the callback.
Distribution of Call backs. Highlights the number of calls made by each ANI, consistently one for once-off callers and varying from 2 to more than 10 for recallers.
Calls Outcome. Depicts the distribution of different call outcomes (FAR HUP: user termination, NEAR HUP: system termination, Transfer, or error), filterable by caller types (recallers or once-off callers). The distribution of different call outcomes (FAR HUP: user termination, NEAR HUP: system termination, Transfer, or error) which can be filtered between different callers types (recallers or once off callers).
Caller Classification. Categorizes callers, with filter options available for different call types. Additional details on caller classification reporting can be referenced for further information.
The visualization incorporates filters for refining views based on:
Organisation
Date