Overview
Reporting in Voice Biometrics (VB) allows users to collect information about the verifications and enrollments, in form of the Overall Verifications Performance report, Enrollments Analysis report, and Opt Out report, on specified configurable dashboards, which are available through Conversational Insights.
Reporting in Voice Biometrics is applicable in both IVR and Agent Voice Biometrics integrations.
To use Reporting in Voice Biometrics, the user should have access to Advanced OCP Conversational Insights®. Contact the Customer Support team for additional access rights.
Reports
Voice Biometrics Overall Verification Performance
This dashboard shows the overall VB verification performance on a daily basis. In this call level analysis we have taken into account the highest verification score for each conversation.
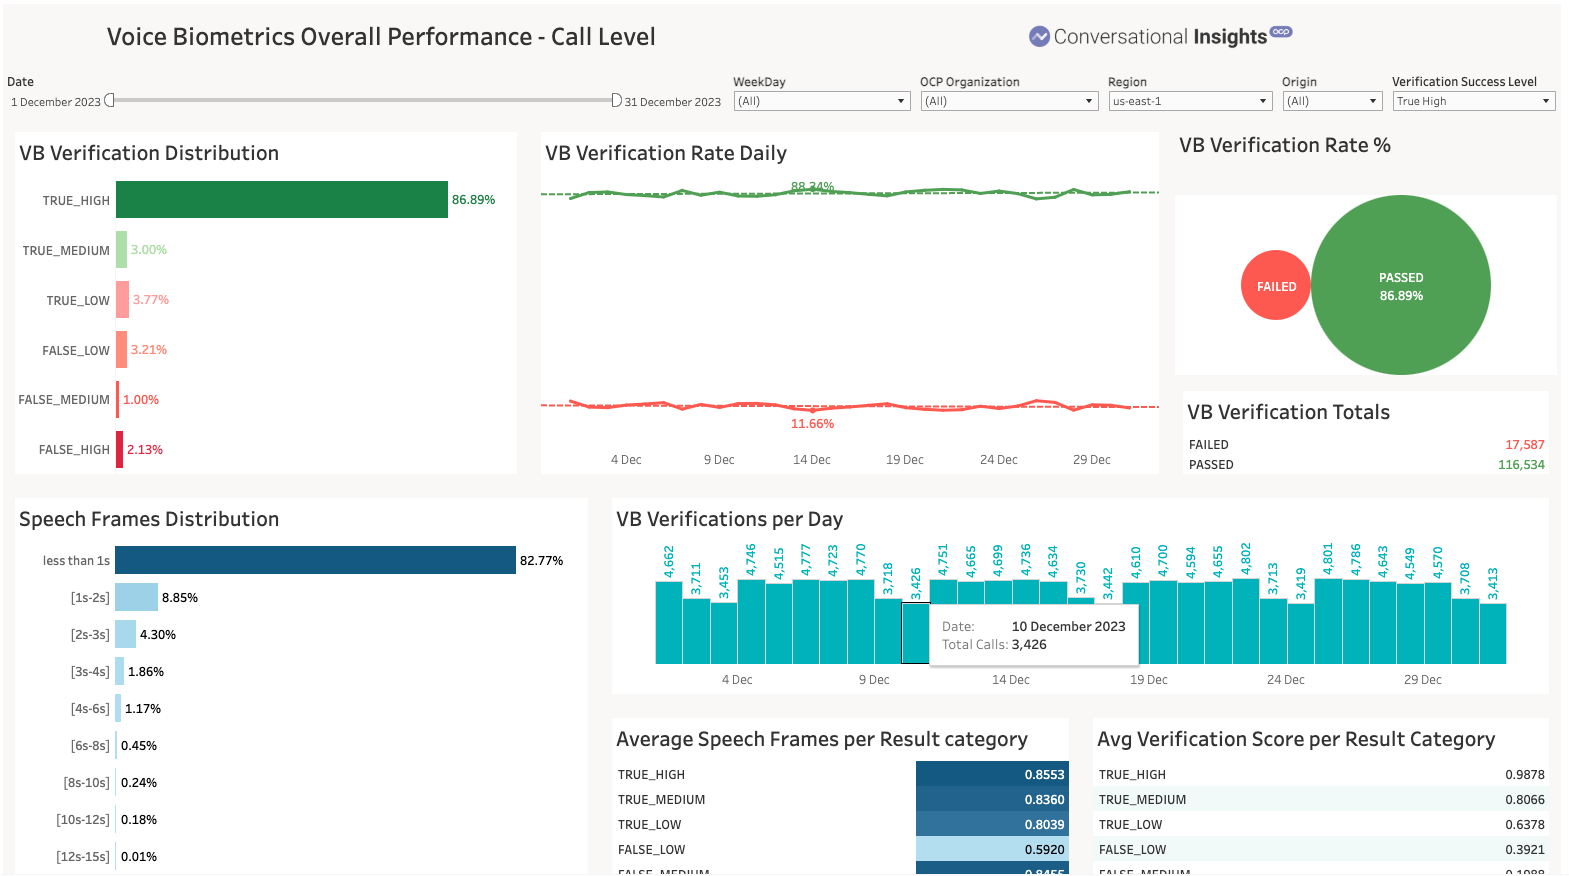
The Overall Verification Performance report includes the following metrics:
-
VB Verification Distribution - the percentage of calls verified by VB and their verification labels: True_High, True_Medium, True_Low, False_Low, False_Medium, False_High.
-
VB Verification Rate Daily - displays the Verification Performance on a daily basis via percentage graphs.
-
VB Verification Rate % - the percentage of VB verified (Passed) and not verified (Failed) calls. In this example, the dialog calls are set VB verified with True High or True Medium verification labels.
-
VB Verification Totals - the total amount of calls which can be separately displayed for Failed and Passed.
-
Speech Frames Distribution - the amount of calls and how much clean speech was used to provide a verification result.
-
Average Speech Frames per Result category - the median speech frames that were used to provide each BioResult.
-
Avg Verification Score per Result Category - the average verification score per each BioResult label.
The data can be filtered using the following parameters:
-
Dialog Date range
-
WeekDay
-
Month
-
Speech frames
-
Verification score
-
OCP Organization (Group) name
Voice Biometrics Enrollment Analysis
This dashboard displays the total number of enrollments in Voice Biometrics in daily breakdown.
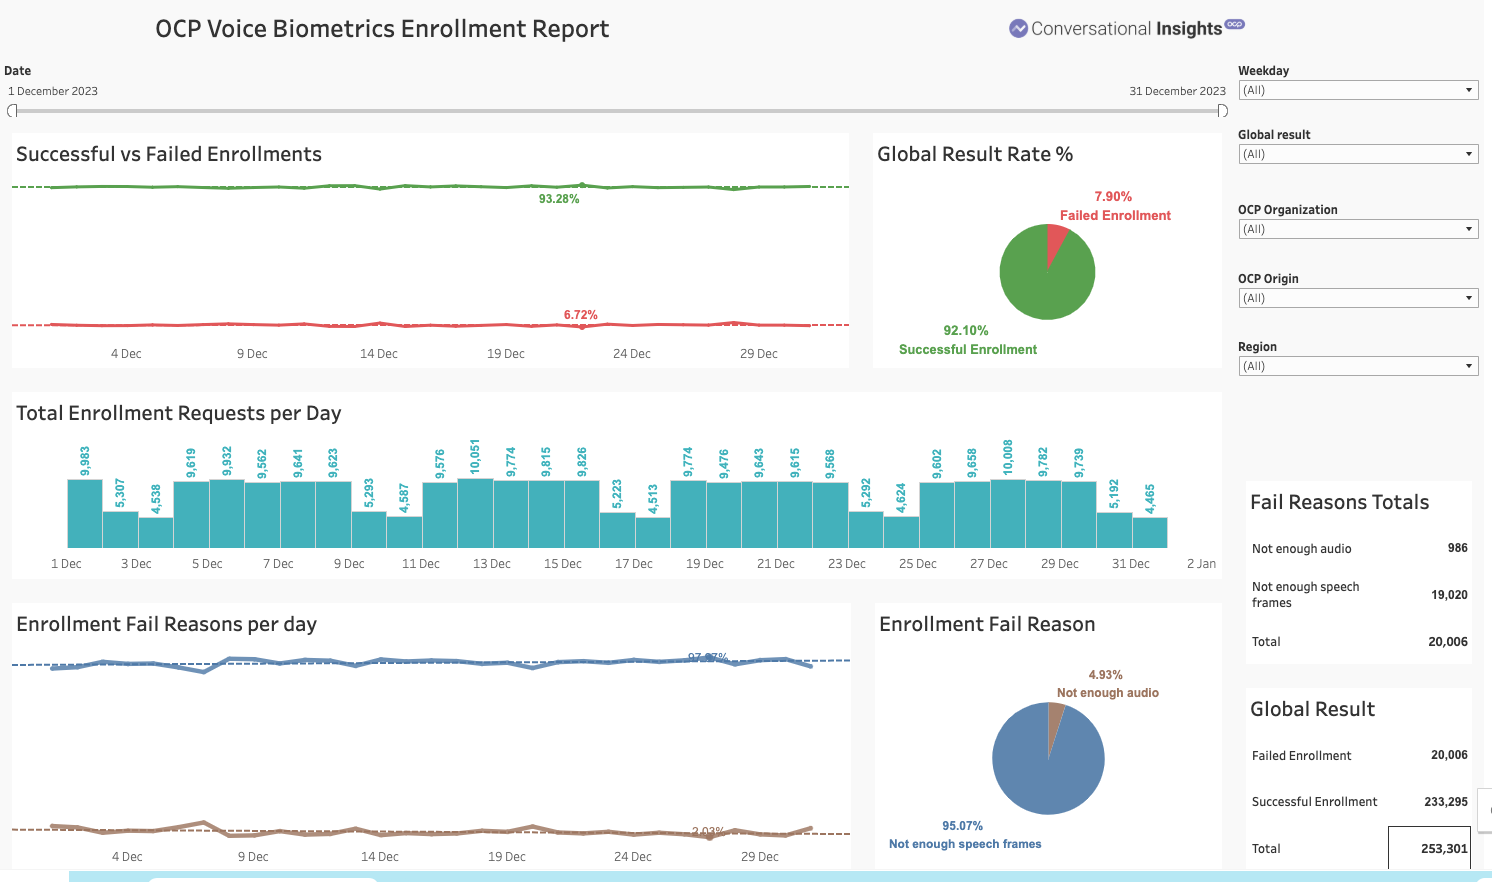
In particular, you can explore the following:
-
Successful vs Failed Enrollments - the graph of Successful and Failed Enrollment Requests for the selected date range.
-
Global Result Rate % - the percentage of successful and failed enrollments.
-
Total Enrollment Requests per day - the graph of Successful and Failed Enrollment Requests daily.
-
Enrollment Fails Reasons per day - the graph of each Fail Reason per day.
-
Enrollment Fail Reason - the percentage of each Fail Reason out of all fails.
The data can be filtered using the following parameters:
-
Dialog date range
-
Global result
-
Enrollment Result
-
Organization (OCP Group) Name
-
OCP Origin (Agent Side vs IVR side)
Voice Biometrics Opt Out Report
This report shows the overall VB Opt Out rates on a daily basis. In this opt out level analysis, we have taken into account the number of users requesting to opt out.
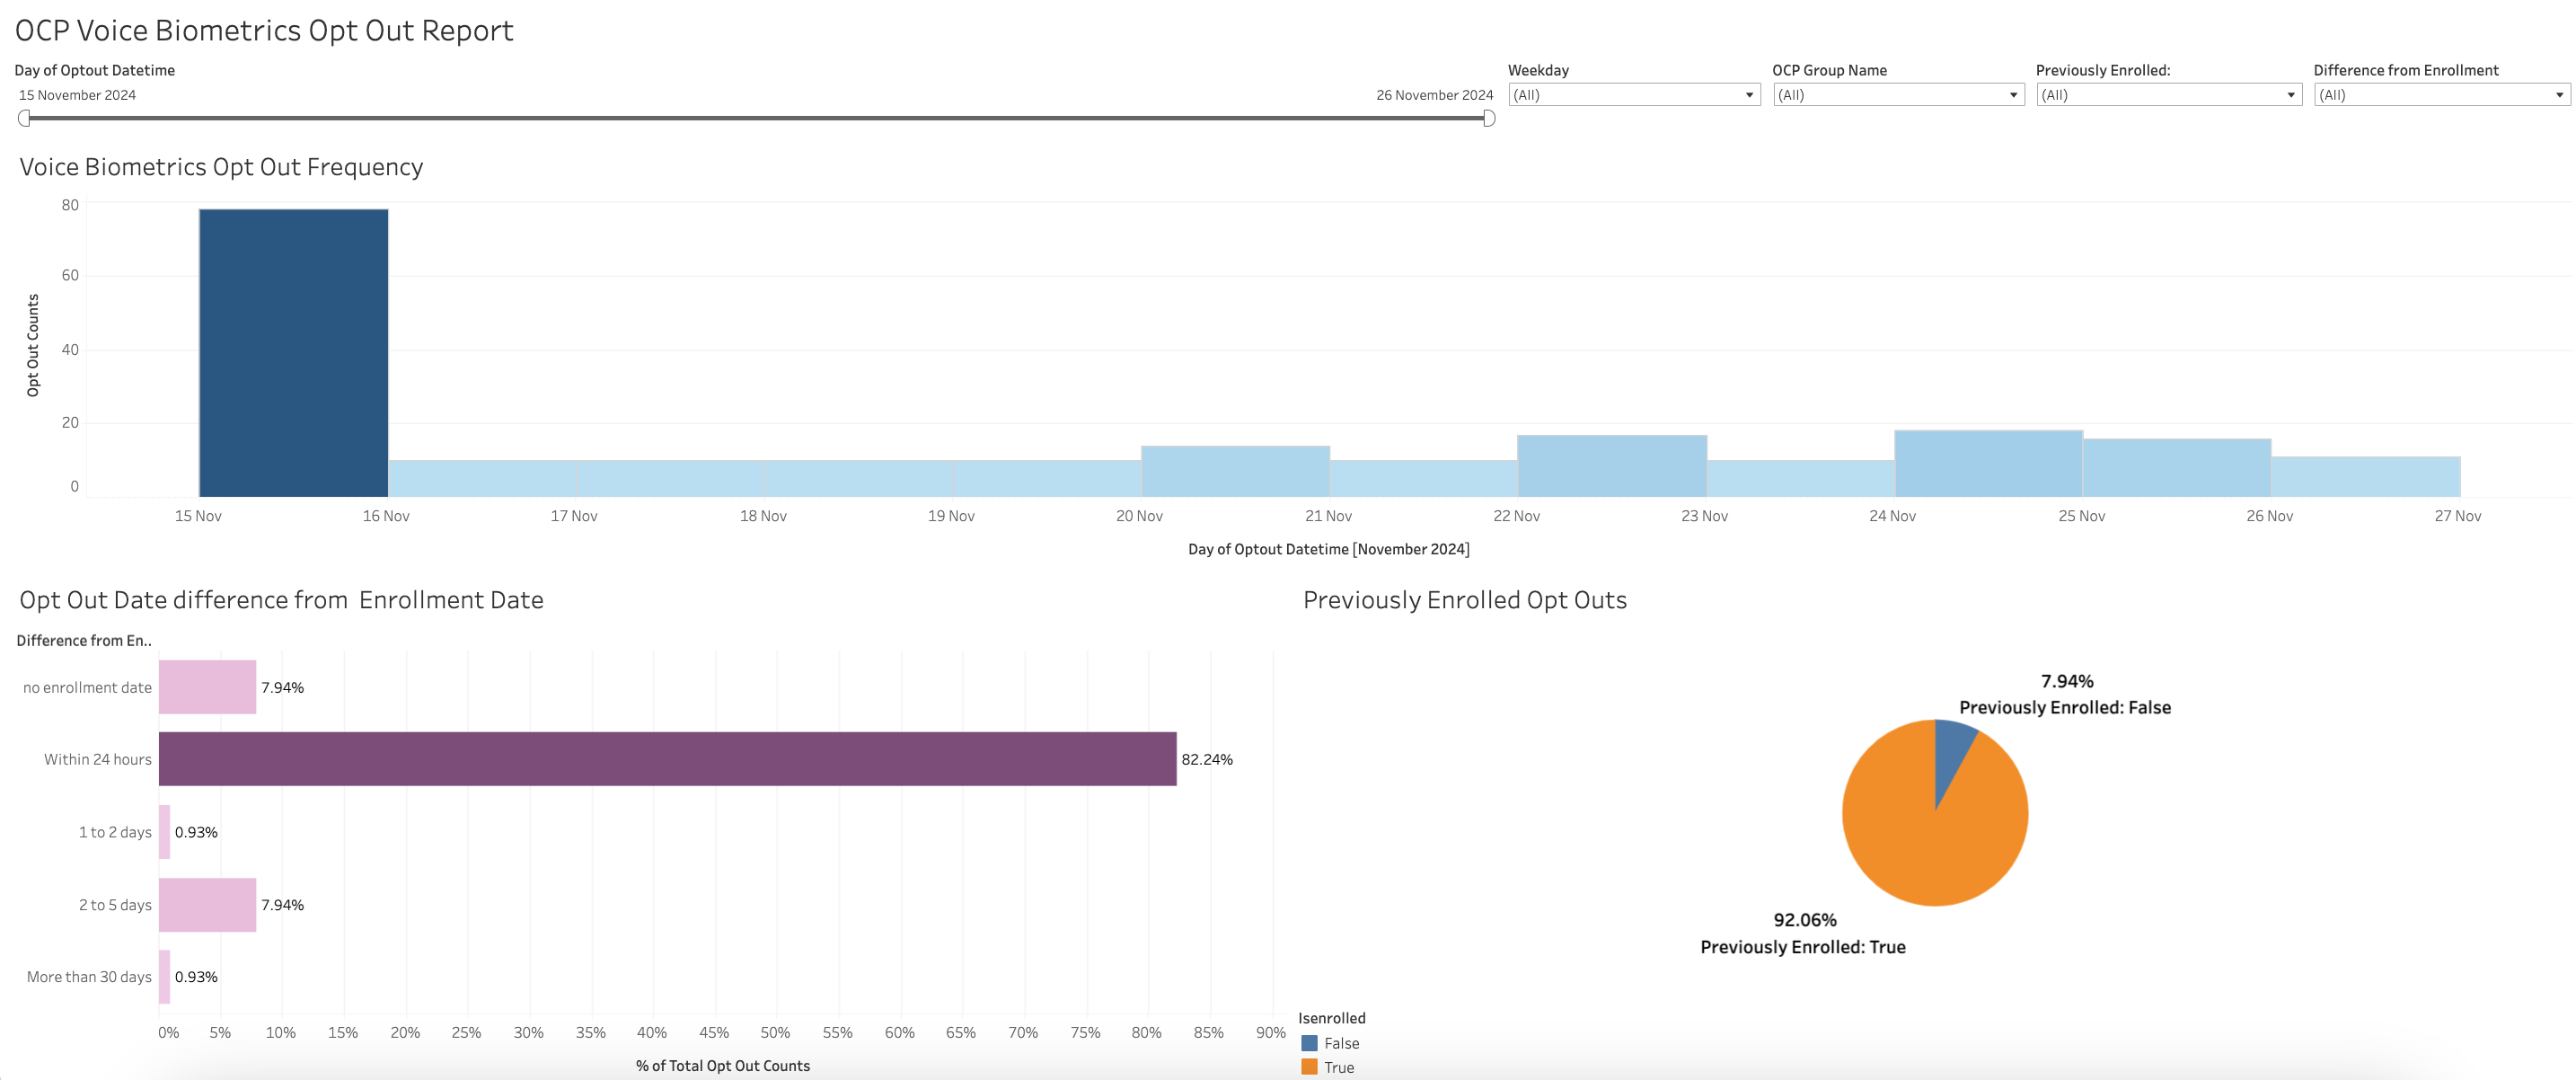
This analysis includes the following:
-
Voice Biometrics Opt Out Frequency - shows the number of opt outs per day within the selected date range.
-
Opt Out Date difference from Enrollment Date - the distribution of difference between enrollment and opt out request, showing how much time has passed after enrollment when a user is requesting to opt out from Voice Biometrics (Within 24 hours, 1 to 2 days, 2 to 5 days, More than 30 days, All, no enrollment date).
-
Previously Enrolled Opt Outs - the percentage of previously enrolled users vs new users requesting to opt out, displaying how many users who requested to opt out were previously enrolled.
The data above can be filtered using the following parameters:
-
Dialog Date range
-
Organization (OCP Group) Name
-
Previously Enrolled Users (True/False)
-
Difference from Enrollment