Overview
Metrics provide essential information about the current status of an Omilia Application. They are derived from a selected set of Omilia KPIs designed to keep users informed about their system’s state without overwhelming them with data.
Metrics are divided into two main types: Real-time and Batch. Both types are publicly accessible through the Metrics API.
Authentication
Navigate to the API Authentication page to learn more about Token creation and Authentication process.
Errors Codes
Omilia's HTTP response codes can be found on the HTTP Code Responses page.
OCP® Metrics API Reference
Types of Metrics
Real-Time Metrics
Real-time metrics are generated in real-time and are broken down into five-minute intervals. They show the current status of the system.
The highest granularity of real-time metrics is five-minute intervals. For example, the end user will be able to see the number of invocations between 10:00-10:05, 10:05-10:10, and so on.
Users can apply a custom sampling rate to both Real-time and Batch metrics using the downsampling parameter. For example, they can request daily metrics for the past month.
Batch Metrics
Batch metrics are exported from the OCP Data Warehouse (DWH) and provide historical information about system status, aggregated on an hourly basis. They are also available through Conversation Insights.
Batch metrics are aggregated on an hourly basis, the same as existing Convo Insights Solutions. For instance, total invocations can be viewed between 10:00-11:00 and then 11:00-12:00. Both types of metrics can be further aggregated to higher levels.
It is advised to make batch metrics requests after the two-hour watermark to ensure late events are updated in the calculations.
Some discrepancy between real-time and batch metrics is expected. This is partly due to possible data delays affecting near real-time calculations. In contrast, batch metrics take longer to generate, allowing them to include delayed data and ensure greater accuracy.
Types of Endpoints
Component Specific endpoints
Component Specific Endpoints generally provide metrics broken down per component, such as miniApps, dialogs, or VB.
-
Component Specific Endpoints for
realtime-metrics-controller:
These endpoints provide Real-time metrics, which are generated in real-time and show the current status of the system. They are broken down into five-minute intervals (e.g., 10:00-10:05), representing the highest granularity available. Users can also apply a custom sampling rate using thedownsamplingparameter. Real-time metrics have a limited retention period of 48 hours. -
Component Specific Endpoints for
batch-metrics-controller:
These endpoints provide Batch metrics, which are exported from the OCP Data Warehouse (DWH) and offer historical information about system status. They are aggregated on an hourly basis (e.g., 10:00-11:00), similar to Conversational Insights. Batch metrics can also be further aggregated to higher levels and have a longer retention period of 720 days. It is advised to request batch metrics after a two-hour watermark to ensure greater accuracy.
Generic endpoints
Version 3.4.0 of Metrics-API introduces new endpoints for custom aggregation of public reporting tables.
The Metrics-API provides five new endpoints for flexible database table querying and analytics. Three endpoints support metrics aggregation operations on any table, while two additional endpoints provide table discovery and schema information capabilities.
The Metrics-API enables flexible querying capabilities for any database table, allowing for time-series analysis, grouping operations, and aggregations. This makes it ideal for business intelligence, performance monitoring, and data analytics use cases.
You can find additional information about the database tables that implements the required interfaces in the corresponding Τables Definition page.
You can find additional information about the Generic endpoints and a quick start guide of how to implement them in the corresponding Generic Metrics Endpoints page.
API Reference
Metrics API v2 has been deprecated. If you're currently using Metrics API v2, please migrate to Metrics API v3. If you're starting a new integration, use Metrics API v3 from the beginning.
New endpoints have been added in Metrics API v3.
You can find more details about the Metrics API v3 endpoints below.
Endpoints with the {version} parameter indicate that the retrieval logic remains unchanged between versions. To retrieve data from these endpoints, simply provide the required value for the parameter (e.g v3 ).
Metrics API Example
The following Time Series example is designed to help you understand how a Production Call with multiple steps and miniApps is represented in real-time metrics.
Click to see the example
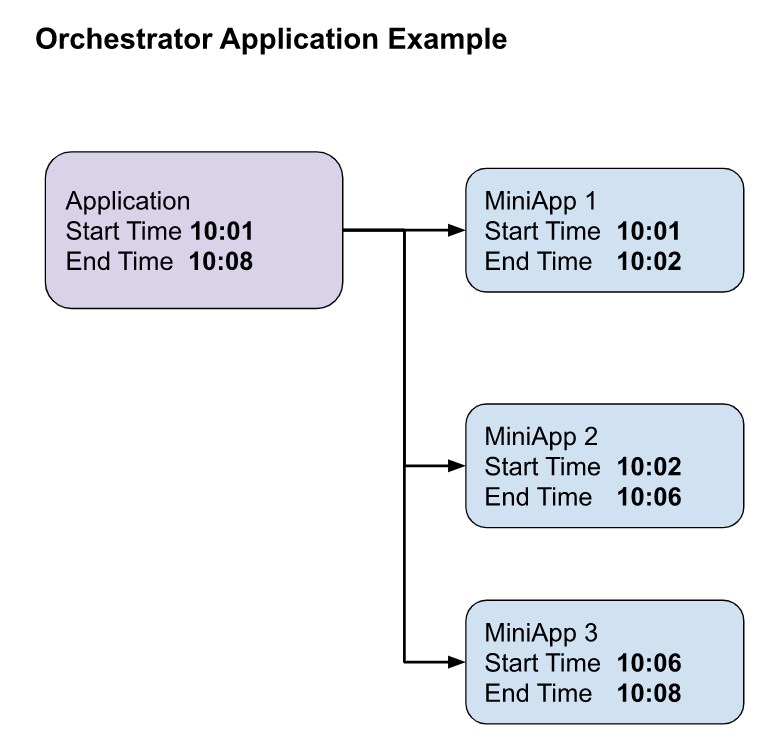
We have a Banking IVR Application built using Orchestrator. The main flow consists of a sequence of three miniApps. A call enters the IVR at 10:01 and exits at 10:08. During this call, the following miniApps are triggered:
-
miniApp 1 starts as soon as the call reaches the application.
-
miniApp 2 starts at 10:02, immediately after miniApp 1 completes.
-
miniApp 3 runs from 10:06 until 10:08, when the call terminates.
Real-Time Metrics Intervals
Real-time metrics are divided into five-minute intervals, with aggregation based on the interval’s start time. In this example, the call spans two intervals:
-
A: 10:00–10:05
Marked as Time Point: 10:00 in the Insights graph. -
B: 10:05–10:10
Marked as Time Point: 10:05 in the Insights graph.
Metrics Outputs
-
miniApp1 Invocation will be recorded in time frame A (after 10:02).
-
miniApp2 Invocation will be recorded in time frame A (after 10:06).
-
miniApp3 Invocation will be recorded in time frame B (after 10:08).
-
The session initiated metric will be recorded in time frame A (after 10:02)
and also in time frame B (after 10:06). -
The dialogs completed metric will be recorded in time frame A (after 10:08),
as this is when it’s confirmed that the call was completed within OCP.
Available Period for Real-Time Metrics
Real-time metrics will have a limited retention period of 48 hours. After this time range, the metrics can be monitored through Conversational Insights. For historical data, the user will be able to monitor their Applications through Convo Insights or Metrics API batch metrics endpoints with a retention period of 720 days.
OCP® Reporting for Real-Time Metrics
Metrics available through Metrics API are also available in the Reporting tab within OCP® Insights. For more information, refer to the OCP® Reporting User Guide.
For more advanced OCP Reporting, visit OCP® Conversational Insights.